Data scientists use t-SNE to visualize high dimensional data sets but, with the wrong hyperparameters, t-SNE can easily make misleading visualizations. We show how to use t-SNE more effectively using new guidance, and we present a prototype for automatically selecting the best hyperparameters for your data!
Data scientists tout t-SNE for its ability to visualize clusters and relationships in high-dimensional data, but t-SNE requires users to carefully select hyperparameters such as perplexity, learning rate, and exaggeration. Good values produce accurate and informative visualizations; bad values produce messy visualizations, or worse, misrepresent the relationships in your data. And picking a good hyperparameter combination is hard because a good combination for one data set might be a terrible combination for different data. This is a well-known problem—t-SNE is more than a decade old and researchers are still looking for good hyperparameters!
This blog post presents an overview of our t-SNE findings, which we will present at the Visualization Meets AI 2022 workshop, and will be published in the Journal of Visual Informatics. In our study, we collected data sets from the UCI Machine Learning Repository, the R “datasets” package, and the KEEL data set repository. We had 691 data sets each with at least three dimensions and between 10 and 10,000 points. We then generated t-SNE visualizations using OpenTSNE on each of the 691 data sets using a grid of t-SNE hyperparameters: exaggeration in {1,2,3,4,5,6,8,16,32,64,128}, learning rate in {10,20,40,80,160,320,640,1280}, and perplexity in {1,2,4,8,16,32,64,128}. After removing invalid combinations, this gave us 236,496 visualizations. We measured the accuracy of each one using 1-KNN accuracy, 10-KNN accuracy, Spearman pairwise distance correlation, and a new rank accuracy metric we developed to measure how well t-SNE preserves the rank ordering of each point to every other point in the original data.
What Are the Best t-SNE Hyperparameters for Your Data?
We can identify which t-SNE hyperparameter ranges tend to perform best on our 691 data sets. For simplicity, we combined our four accuracy metrics by averaging them into the Mean Accuracy Metric (MAM). To generate the scatterplots below, we compare the average Mean Accuracy Metric across all data sets to the Mean Accuracy Metric of an “oracle” that always chooses the best hyperparameters for each data set. Darker colors show hyperparameter combinations that generate more accurate visualizations on average. And bigger circles show hyperparameter combinations that have more variation in the accuracy of the visualizations they make. In other words, circles that are darker and smaller generally represent hyperparameter combinations that work better in practice.
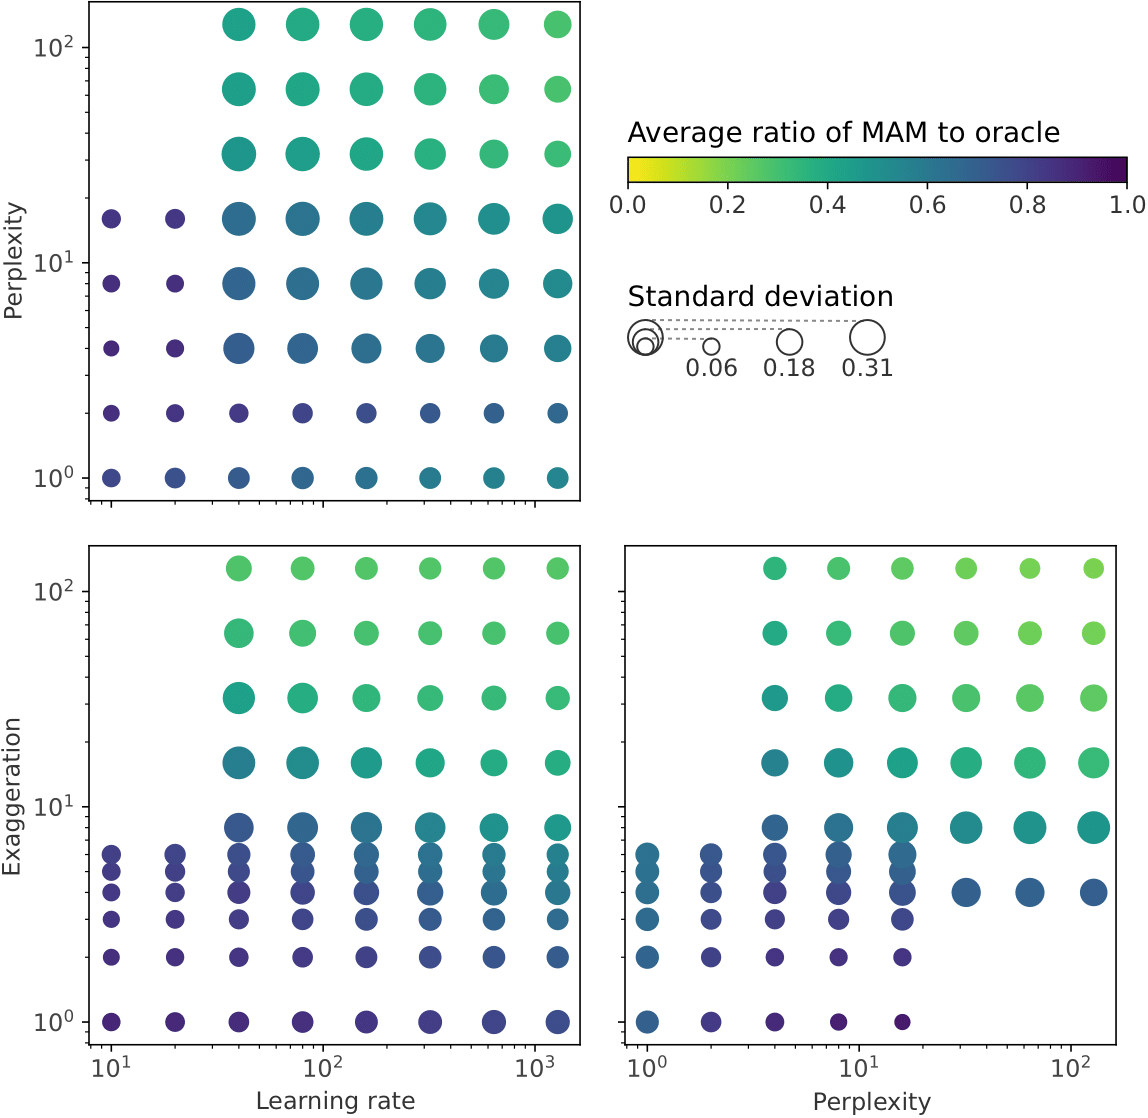
Looking at this figure, we find the useful range of hyperparameters is both narrower and has lower values than previously suggested. The best hyperparameter combination for a data set is most likely to have perplexity in the range 2–16, exaggeration in the range 1–8, and learning rate in the range 10–640. In contrast, van der Maaten and Hinten suggested perplexity should be in the range 5–50, and the sklearn documentation suggests learning rate values in the range 40–4,000 (after adjusting due to difference in implementation). We find those ranges too wide and too large in value to be useful for the data sets that we analyzed.
We also found that setting perplexity = 16, exaggeration = 1, and learning rate = 10 gave us the best Mean Accuracy Metric on the most data sets. In fact, it substantially outperforms the sklearn default, and it performs comparably to the OpenTSNE settings despite being simpler. We suggest this “empirical” combination would make a good default. If you’re unsatisfied with the visualization, then try different hyperparameters in the ranges we found above.
t-SNE Guidance
We summarize our results and recommendations for using t-SNE as follows:
- Use our “empirical” hyperparameter combination or OpenTSNE’s default hyperparameters for good general visualizations. This balances accurate nearest neighbors and distances in visualizations. Prefer OpenTSNE’s default hyperparameters if you prioritize accurate distances over accurate neighbors, and prefer our “empirical” hyperparemeter combination if you prioritize accurate neighbors (see below for more details).
- Avoid t-SNE default hyperparameters in old versions of sklearn. The new sklearn default in v1.2 will be in line with OpenTSNE, so either upgrade sklearn, use our “empirical” hyperparameters, or use OpenTSNE.
- If those hyperparameters don’t produce good visualizations, try using perplexity in the range 2–16, exaggeration in the range 1–8, and learning rate in the range 10–640. We found that accurate visualizations tended to have hyperparameters in these ranges. To guide your exploration, you can first try perplexity near 16 or n/100 (where n is the number of data points); exaggeration near 1; and learning rate near 10 or n/12.
The Future of Dimensionality Reduction: Automatically Finding Optimal Hyperparameters
What if you don’t have to guess which t-SNE hyperparameter values to try? What if it could automatically figure out the best hyperparameter combination for you? We found it’s possible to do that!
We use machine learning to predict optimal t-SNE hyperparameters for a data set. To do this, we featurize a data set by finding its number of data points and dimensions, and by calculating the mean and variance of Scagnostic measures on random projections of the data. This gives us a feature vector per data set. Given a data set’s feature vector and a combination of t-SNE hyperparameters, we train a neural network to predict the four accuracy metrics of the resulting t-SNE visualization on that data set. We use the accuracy metrics from the grid search of t-SNE visualizations for training data. Then we iterate over hyperparameter combinations to find the one with the best predicted accuracy (or Mean Accuracy Metric) for a data set. Iteratively predicting on the neural network is way faster than the brute force method of generating lots of t-SNE visualizations and then picking the best one!
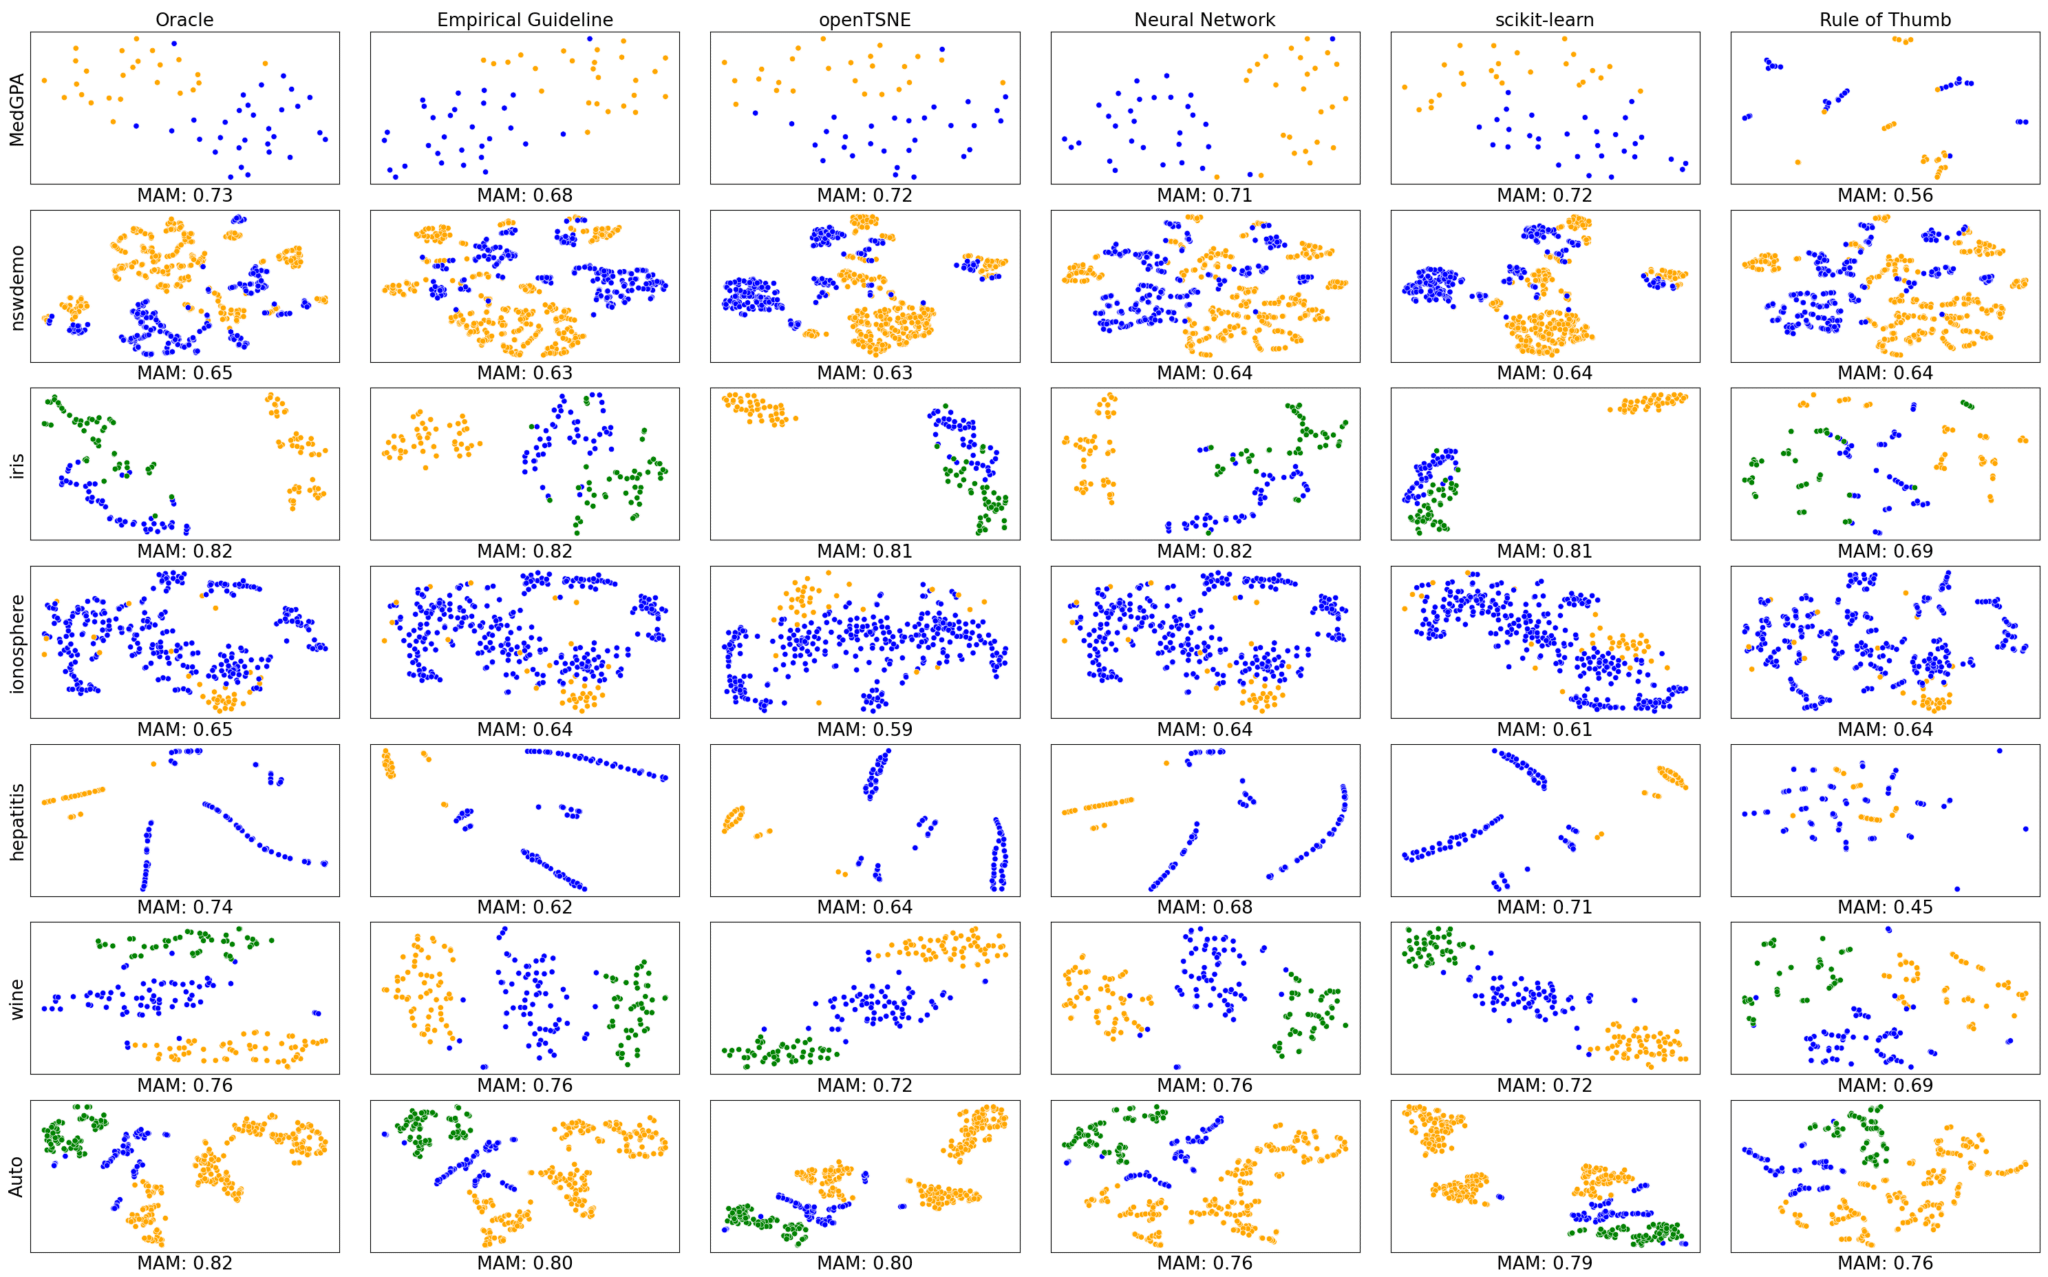
We found this approach works at least as well as any other method. We compared hyperparameter combinations recommended by our neural network method to our “empirical” hyperparameter combination, the OpenTSNE default, the sklearn default, and a “rule of thumb.” The “rule of thumb” was an amalgamation of guidelines from the literature. We found no statistically significant difference between the empirical, OpenTSNE, and neural network methods. (Note that our neural network is a prototype method without optimized features, network architecture, or training process. So with more effort or more data our neural network might beat the other methods.)
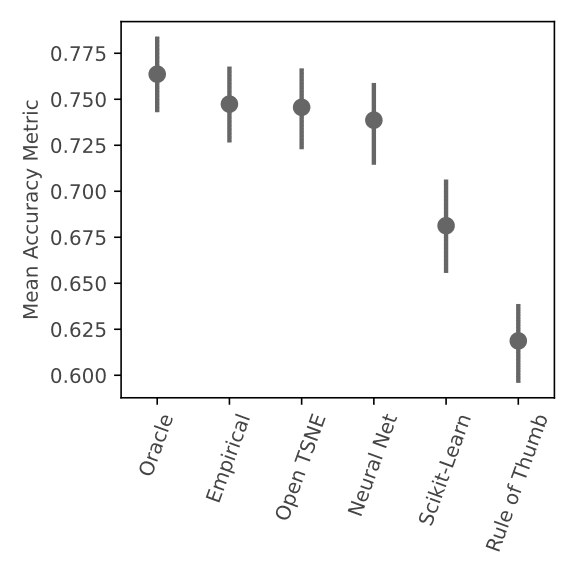
We also found that none of these methods perform as well as the “oracle” that always picks the best hyperparameters from our grid. So a brute force grid search method would beat the other options, but would be very slow to generate so many visualizations. However, this result does indicate that there is room for future research to pick better t-SNE hyperparameters.
We do note that the hyperparameter defaults in sklearn prior to v1.2 perform very poorly compared to the other options. It’s best to upgrade sklearn or use different hyperparameters.
In our paper we breakdown this analysis in more detail. One thing we found is that our neural network and “empirical” hyperparameter combination are both better at preserving nearest neighbor accuracy than the OpenTSNE default hyperparameters. On the other hand, OpenTSNE’s default hyperparameters are better at preserving distances.
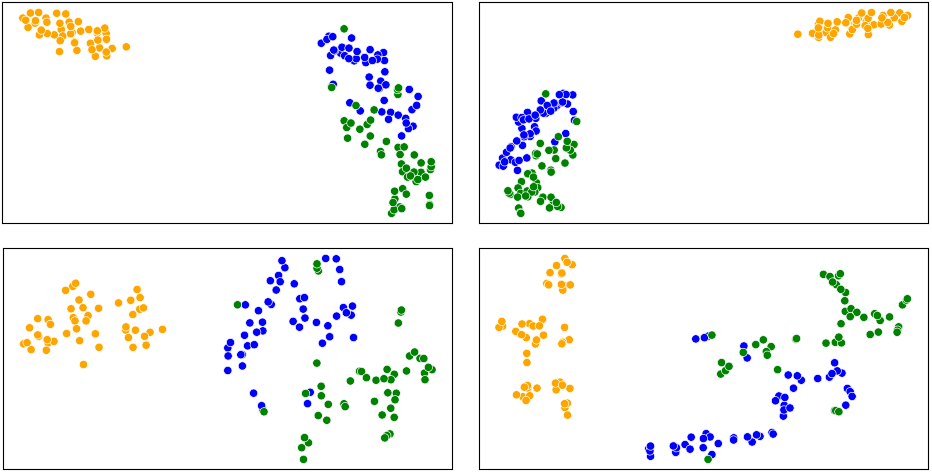
Below are some example data sets using the different t-SNE hyperparameter methods.
Summary
The question of how to pick good t-SNE hyperparameters is important because it helps us visualize our data more accurately. And this question is not going away; new techniques like UMAP are proving to be popular, too, and UMAP has been shown to be related to t-SNE. So UMAP would benefit from a similar analysis to what we’ve done here to help guide users in picking optimal UMAP hyperparameters. We could also extend this work by including larger data sets from different domains; we used real tabular data sets, but we might get different results with large data sets from domains like image classification or single-cell transcriptomics.
t-SNE has several hyperparameters that control visualization accuracy. Perplexity, learning rate, and exaggeration are common, but others could be examined in future work.
Our paper has a lot more info than we can fit here—check it out for more details!
Robert Gove, Lucas Cadalzo, Nicholas Leiby, Jedediah M. Singer, Alexander Zaitzeff. “New Guidance for Using t-SNE: Alternative Defaults, Hyperparameter Selection Automation, and Comparative Evaluation.” Journal of Visual Informatics (proc. Visualization Meets AI 2022). [pdf]