A Networked Backbone for Large-Scale Radiation Detection

Over the past 30 months Two Six Labs along with our teammates at Eucleo have been hard at work proving out a reference architecture for DARPA’s SIGMA program that will, when fully realized, be capable of processing radiation data from thousands of portable detectors – deployed in any number of static and mobile configurations – all to increase situational awareness and early warning detection of potential threats. The goal for Sigma is to be able to deliver radiation alerts to a watch officer within seconds from the time a detector passes an unknown threat. For those on the architecture team, there has never been a greater urgency to ensure the availability of a system that is truly fault tolerant, redundant, and by the nature of the volume and velocity of radiation data – roughly 1KB/sec per deployed detector – massively distributed.
This post provides some initial insights into our backbone implementation, an amalgamation of open source web-scale technologies released to the community by the likes of Facebook, LinkedIn, and Twitter that have been engineered into a solution that has proven to be a robust and reliable foundation for our architecture. Currently at 35 AWS compute instances supporting our production system of up to 1000 deployed detectors, this framework has been tested with simulated loads up to 10,000 detectors simply by dialing up additional compute nodes and rebalancing workloads – processes that can be done without impacting real-time operations.
Technology Stack
We recognize that the end state of our system could be deployed anywhere and, as such, we need to prepare for any likely installation target. In the interim, we’re deploying on AWS, but the option to run on AZURE, GCE, or locally procured hardware remains depending on security restrictions and customer preference. As a result, thus far we’ve limited the lure of managed services. No doubt they are attractive from a time to deliver mindset, but spending the additional time working directly with open source counterparts has provided great flexibility for future deployments.

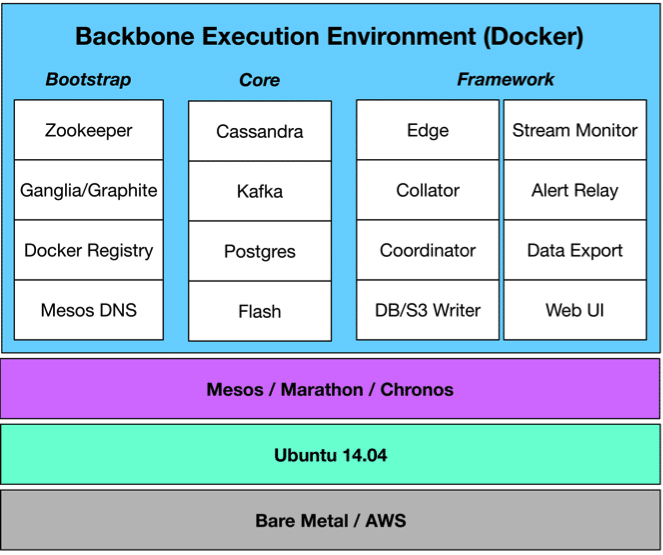
At the core, and with a few exceptions, every aspect of the architecture is deployed as a Docker container. This “everything-as-a-container” approach has provided great flexibility by being able to build and test (and even ship) various parts of the framework in isolation. Docker is great for that. We also perform system integration of signal processing algorithms developed by various co-contractors and teammates. Docker is a great enabler for that too. Docker doesn’t come without its deployment challenges – such as container flight with ephemeral volumes and the need to switch between bridged and host networking, but we’ve managed to iron out a reasonable approach that overcomes many of these issues.
Beyond Docker, we use Apache Mesos as our cluster manager along with Marathon for orchestrating our Docker containers – currently at 120. Both utilize zookeeper and represent the entirety of what’s directly installed on a host.
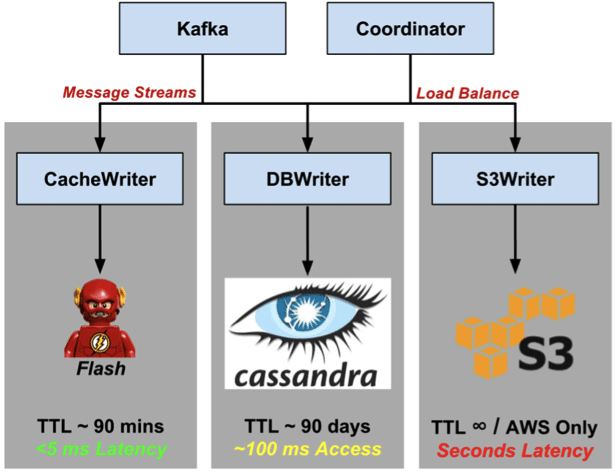
Our data model is defined using Apache Thrift of which payloads are generated at the point of origin (radiation detectors and phones running Android OS) and transmitted via cellular networks into the backbone and storage. Upon arrival into the backbone, Thrift messages are published via Apache Kafka using topics based on the names of the Thrift structs and persisted in a three tiered storage architecture (discussed in greater depth in a subsequent section) that consists of a home brew in memory cache, Apache Cassandra and Amazon’s S3 Block Storage.
Once all of our containers are launched, discovery happens with mesos-dns. All of our system configurations and deployments are defined using container hostnames (e.g. postgres.marathon.cluster_name). This provides very predictable addressing regardless of the host that eventually executes the container. Most of our clusters run multiple mesos-dns containers and domain forwarders are enabled from the primary dns servers to each of the clusters. This provides the ability to easily address any container running in any cluster.
Scaling Blueprint

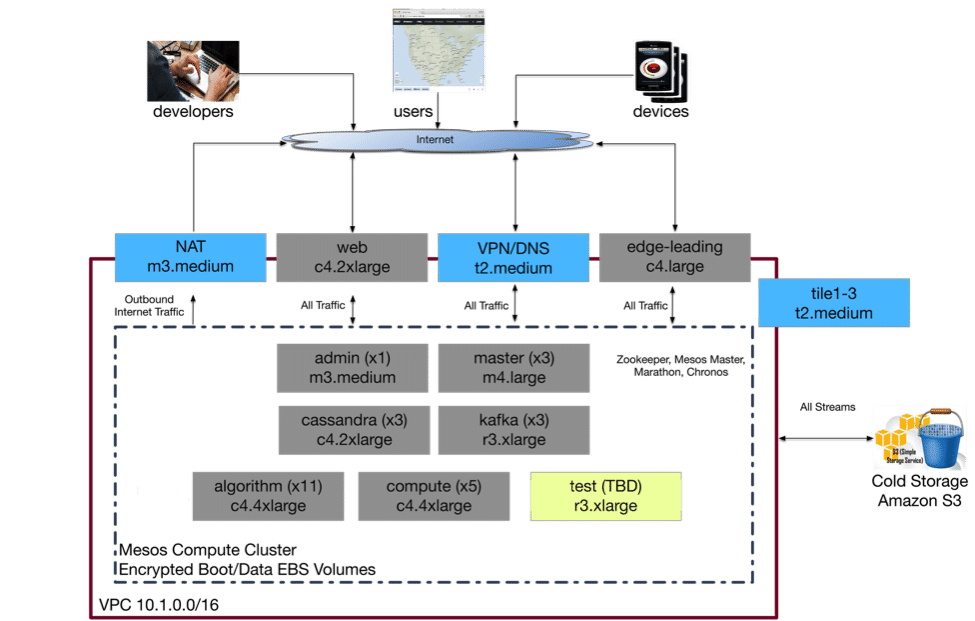
When it comes to AWS instance types, there’s nearly something for every task. The challenge for us was finding the right balance of compute power to address our short-term requirements (the minimal cluster reconfiguration after the fact) and doing so at a reasonable cost. We tend to group instance types by RAM/core ratio – that is, gigs of ram per virtual core. Most of our backbone tasks are “core heavy”, meaning that ~ 1.875GB of RAM per vCore as provided by the C4 class is generally sufficient for processing.
Our cluster is split by functional area (e.g. algorithms, cassandra, kafka, general compute) allowing us to group similar processing tasks and segregate others. This approach ensures that I/O heaving tasks (e.g. cassandra and kafka) run on separate instances. It also provides the ability to scale different parts of the system based on load – the decision to add more algorithms is different than the need to add another cassandra node. We use a straight 2x redundancy across the board – primarily due to cost, meaning that we can survive one failure per functional area before loss of data.
Pacing for a Marathon
Marathon has provided a really good way to manage containers and handle redeployments in light of host or service failures. All of our container deployments make use of Marathon constraints to direct the class of machine to run the container (cassandra and kafka are both managed by Marathon but run on separate instance types). To make this happen, all of our mesos slaves use attributes to define the type of node (as depicted in the scaling blueprint) that are automatically assigned at instance provisioning time.
ubuntu@kafka1:~$ cd /etc/mesos-slave/
ubuntu@kafka1:/etc/mesos-slave$ cat attributes
node_type:kafka
Attributes map very nicely to Marathon constraints that are honored at container launch time:
{
    "id": "kafka-1",
    "instances": 1,
    "cpus": 4.0,
    "mem": 27000,
    "constraints": [
    [
       "node_type",
       "CLUSTER",
       "kafka"
    ]],
...
Constraints as well as other sizing information are all well and good and Mesos honors these perfectly fine. The challenge, for us, is often tracking down containers that are permanently stuck in a “WAIT” state (received by Marathon but not staged in Mesos). From our experience, this is normally attributed to a constraint violation – lack of port, cpu, memory. Tracking these errors down is a bit of a bear. Unfortunately, nothing is currently presented in the Marathon web UI, rather is logged to /var/log/syslog on the active Marathon master.
...
Dec 30 14:27:29 master1 marathon[12351]: [2016-12-30 14:27:29,224] INFO Offer [e6606164-e177-4bfd-8b6d-63918702367d-O3981673].
    Constraints for run spec [/export] not satisfied.
Dec 30 14:27:29 master1 marathon[12351]: The conflicting constraints are: [field: "node_type"
Dec 30 14:27:29 master1 marathon[12351]: operator: CLUSTER
Dec 30 14:27:29 master1 marathon[12351]: value: "fakenode"
Dec 30 14:27:29 master1 marathon[12351]: ]
...
Container Flight with GlusterFS
Let’s face it, while containers and mesos have greatly simplified “run anywhere” deployments, fault tolerance of a single container – a.k.a “container flight” still remains a challenge when ephemeral volumes are at play. Case in point for our architecture, we have a few services that we’ve elected to not run in HA configurations (e.g. PostgreSQL) as they do not represent mission critical elements and we can survive a few seconds of downtime. Our solution, to date, has been to utilize glusterfs on our compute notes. In order to avoid the split-brain scenario with PostgreSQL, we have marathon constraints to ensure we only ever have a single instance deployed at a time.
Build Management with Jenkins
We use a pretty vanilla configuration of Jenkins to build our git repos and docker images. Originally, sticking with the docker purest theme, we attempted to run Jenkins master and slaves as containers deployed via mesos, see: Jenkins Slave and Building Docker Images within Docker Containers via Jenkins
We’ve had some early luck with this approach, and we’ll admit that we had some docker-in-docker containers running (which sounds a bit crazy), we ultimately had to segment Jenkins into a separate cluster due to some unpredictable performance hits on the host during system builds.
When building docker images, we employ a few container naming conventions that help determine the builds and commits that lead to the container push. This is done by adding labels to each image that capture key artifacts like container version, name of git repo, build time, build job #, git branch and commit hash. These artifacts are later dynamically retrieved from the docker registry and stored as Marathon labels in the marathon task json file:
"labels": {
   "backbone.version.cinumber": "b158",
   "backbone.version.githash": "2a0b12d",
   "backbone.version.stamp": "4.0.0-SNAPSHOT_20161026-2016_2a0b12d_b158",
   "backbone.version.project": "exporter",
   "backbone.version.time": "20161026-2016",
   "backbone.version.name": "4.0.0-SNAPSHOT"
}
Marathon labels are presented in the web UI and are accessible in the REST API, so we have a systematic way to trace down the commit and jenkins build that is responsible for a particular container.
Private Docker Registry
Our build server pushes new docker images for each git commit to master or a release branch (including commits to upstream dependencies). While it sounds a bit heavy handed, this approach provides the ability to test incremental releases by commit and Jenkins job at the cost of storing extra image layers. We run our own docker registry (built from docker’s registry:2 image) with a custom configuration that utilizes a S3 storage backend. After a bit of tweaks to the config.yml, we’ve had pretty good success running with the following storage configuration block:
storage:
  maintenance:
    uploadpurging:
      enabled: true
      age: 168h
      interval: 24h
      dryrun: false
  cache:
    blobdescriptor: inmemory
  s3:
    accesskey: <<AWS_ACCESS_KEY>>
    secretkey: <<AWS_SECRET_KEY>>
    region: us-east-1
    bucket: our-docker-registry
    encrypt: true
    secure: true
    v4auth: true
    chunksize: 5242880
All of our clients are authenticated with the docker registry by way of certs installed during host provisioning time.
Data Access Tiers

We hold 72 hours of data in our kafka topics, just long enough to recover from a system failure, and use partitions as an effective way to distribute processing load across multiple instance of an algorithm (a single algorithm container cannot directly process the full stream). Since our system is expected to grow with new radiation detectors being added over time, expanding and rebalancing partitions is a periodic necessity. Out of the box support for this is a bit manual, we had to write some tools to help automate the process and are planning to open source those in the near future.
Beyond kafka, we have a data access tiers that service the variety of data use cases required by our system. Some algorithms require additional “nearby” data to perform a more accurate analysis, over what is already provided in the message stream. These queries need low-latency responses (< 5ms) to be able to sustain real-time processing. After some experimenting with a few in-memory (MemSQL, Crate), we opted to roll our own solution to hold 90 minutes of data with geographic indexing.
The remainder of our query use cases are a direct fit for Cassandra and a simple time series data model:
CREATE TABLE topic_name (
    payloadid uuid,
    date text,
    time timestamp,
    msgid uuid,
    message blob,
    PRIMARY KEY ((payloadid, date), time, msgid)
);
The metadata provides just enough options for query – we frequently pull radiation data – a serialized Thrift blob – for a known detector (payloadid) over a time period. The composite primary key orders data by payloadid (partition key) and date (clustering key). Records are then ordered by ascending time and leverage the date tiered compaction strategy (DCTS) which was designed specifically for timeseries access patterns. Data lives in Cassandra for about 90 days – a TTL that is assigned at table creation time. While query latencies are largely driven by time period, the average query is serviced in ~ 100ms.
Finally, a copy of every stream is persisted in S3 as a permanent archive. We use a single bucket with per-topic folders. Data is committed every 60 seconds or 32MB, whichever comes first, using a key format yyyyMMddHHmm coupled with an AtomicInteger at the end to catch multiple commits during the same minute. This format allows for time-based range scans and replays with typical queries retrieving a day (20161229) or hour (2016122913) of data. We measure latency from S3 on the order of seconds per query.
Metrics and Monitoring

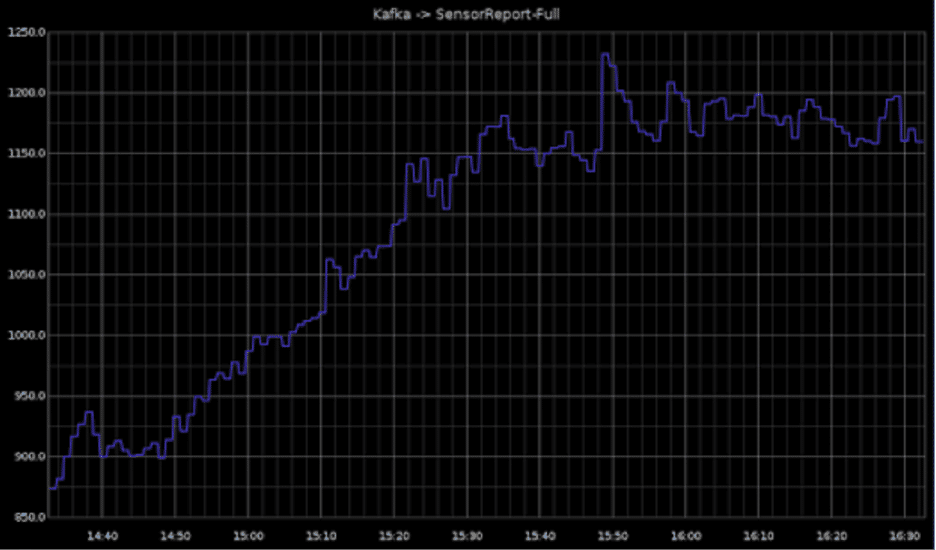
With 35 AWS instances and 120 containers – system monitoring and problem diagnosis starts to get a bit challenging. We’ve become a big fan of all things metrics: host, core service, framework and make use of graphite dashboards. Almost every dependency we use provides some way of introspection. From REST APIs (Mesos, Marathon), JMX (Kafka, Cassandra), to some custom collection with statsd, dashboards provide the at-a-glance views of aggregated performance across the cluster.
While staring at dashboards are valuable, we also like to know when failures occur, particularly those that happen off-hours and over weekends and holidays – for some reason our system doesn’t break during “normal” working hours. We have a number of monitors deployed – each deploy alerting via SMS, email, slack (or all the above).
- AWS Cloudwatch – high CPU, low memory, low disk, accessibility
- Stream Monitor – custom code that watches our ingress streams to ensure that it never drops below a certain threshold – meaning that external devices are having issues communicating to the backbone.
- Burrow – checks for offset lags in kafka consumers. Problems often lead to message consumption issues, so burrow has become a swiss army knife for detecting many issues in the system. It even monitors our monitoring systems.
About Two Six Labs
Two Six Labs is an innovator in the fields of cyber security, data science, machine learning, data visualization, distributed computing, vulnerability research, reverse engineering, mobile and embedded systems, IoT security and distributed sensor networks. Two Six Labs works extensively with government agencies, universities, and private firms on a wide range of R&D efforts, many focused on national security. Two Six Labs slogan “Invent with purpose” describes their focus on creating cutting edge technology that aids and protects citizens and servicemen. To learn more about Two Six Labs visit http://twosixtech.com
This research was developed with funding from the Defense Advanced Research Projects Agency (DARPA). The views, opinions and/or findings expressed are those of the author and should not be interpreted as representing the official views or policies of the Department of Defense or the U.S. Government.
Distribution Statement A
Approved for public release; distribution is unlimited.


