Software developers regularly choose open source libraries to help write code quickly and easily. For small one-off projects it’s pretty simple—do a quick search and then use pip or npm to install a library. But for larger or longer-term projects, open source libraries that won’t be a risk down the road are needed. A library might be a risk because parts of it are incompatible with your product roadmap, or the authors stop maintaining the library. Some risks, like poor documentation, are easy to assess. But we found that other risks relating to library maintenance are harder to assess. We decided to explore how a simple dashboard embedded in GitHub could help us better assess these risks to our projects.
Which library should we use? For example, what if we want to add a machine learning component to our product. Several people have written guides to choosing open source libraries. Many guides suggest checking if the library is actively developed and supported, but they also say this can be hard to check. We agree.
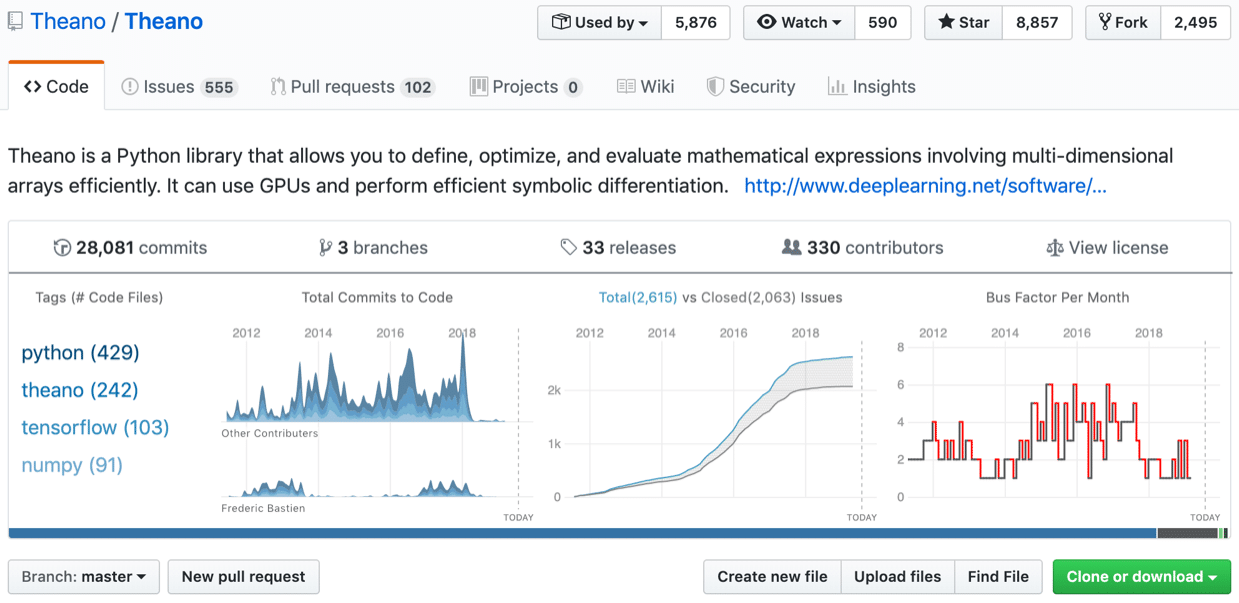
If we were considering using Theano we might look at its GitHub repo to get a sense of its maintenance level and technologies used. But this task is hard. The screenshot below shows the most recent push to main was 14 days from when we took the screenshot. Scrolling through the files we see most changes occurred more than a year ago. Clicking on the list of commits shows only 10 recent ones by three developers. Clicking the Insights button shows a list of 100 contributors, and a steep decline in commits in 2017. Finding the core developers doing most of the work requires a lot of manual effort. Similarly, we have no easy way to see if responsiveness to community issues declined. In short, answering these important questions is not straightforward.
Risks for Choosing Open Source Libraries
We would like an easier way to assess these risks from using a library:
- Single Point of Failure.
A software library may have a small number of primary contributors for the project, or a small number of primary contributors for important functionality. This results in a single point of failure. The project is at risk of not being maintained if those contributors leave the project. - Unresponsive to Community.
Are the library developers unresponsive to feature requests or bug reports from the community? Then the library users may have to perform extra work to patch the library for their own needs. - Low Ratio of Contributors to Project Size.
Large projects with few contributors may be more likely to have components or features that are not being actively maintained. Or the library developers may be less responsive to feature requests or bug reports from community members. - Inactive Developers.
Projects with inactive developers are less likely to be maintained. This results in less responsiveness to community requests and fewer releases of new library versions. - Project Decline.
Due to technological advancement and changes in the library developers, older projects are more likely to become outdated, deprecated, or inactive. - Unsuitable Technology.
The library could use a technology, such as a programming language or database, that is unfamiliar to you. This increases the effort needed to use the library and increases the risk that you may not be able to use the library to its full extent. Alternatively, the library could use another library or technology that is at risk of becoming outdated, deprecated, or inactive, thereby posing a risk to the library you’re considering.
A New GitHub Dashboard
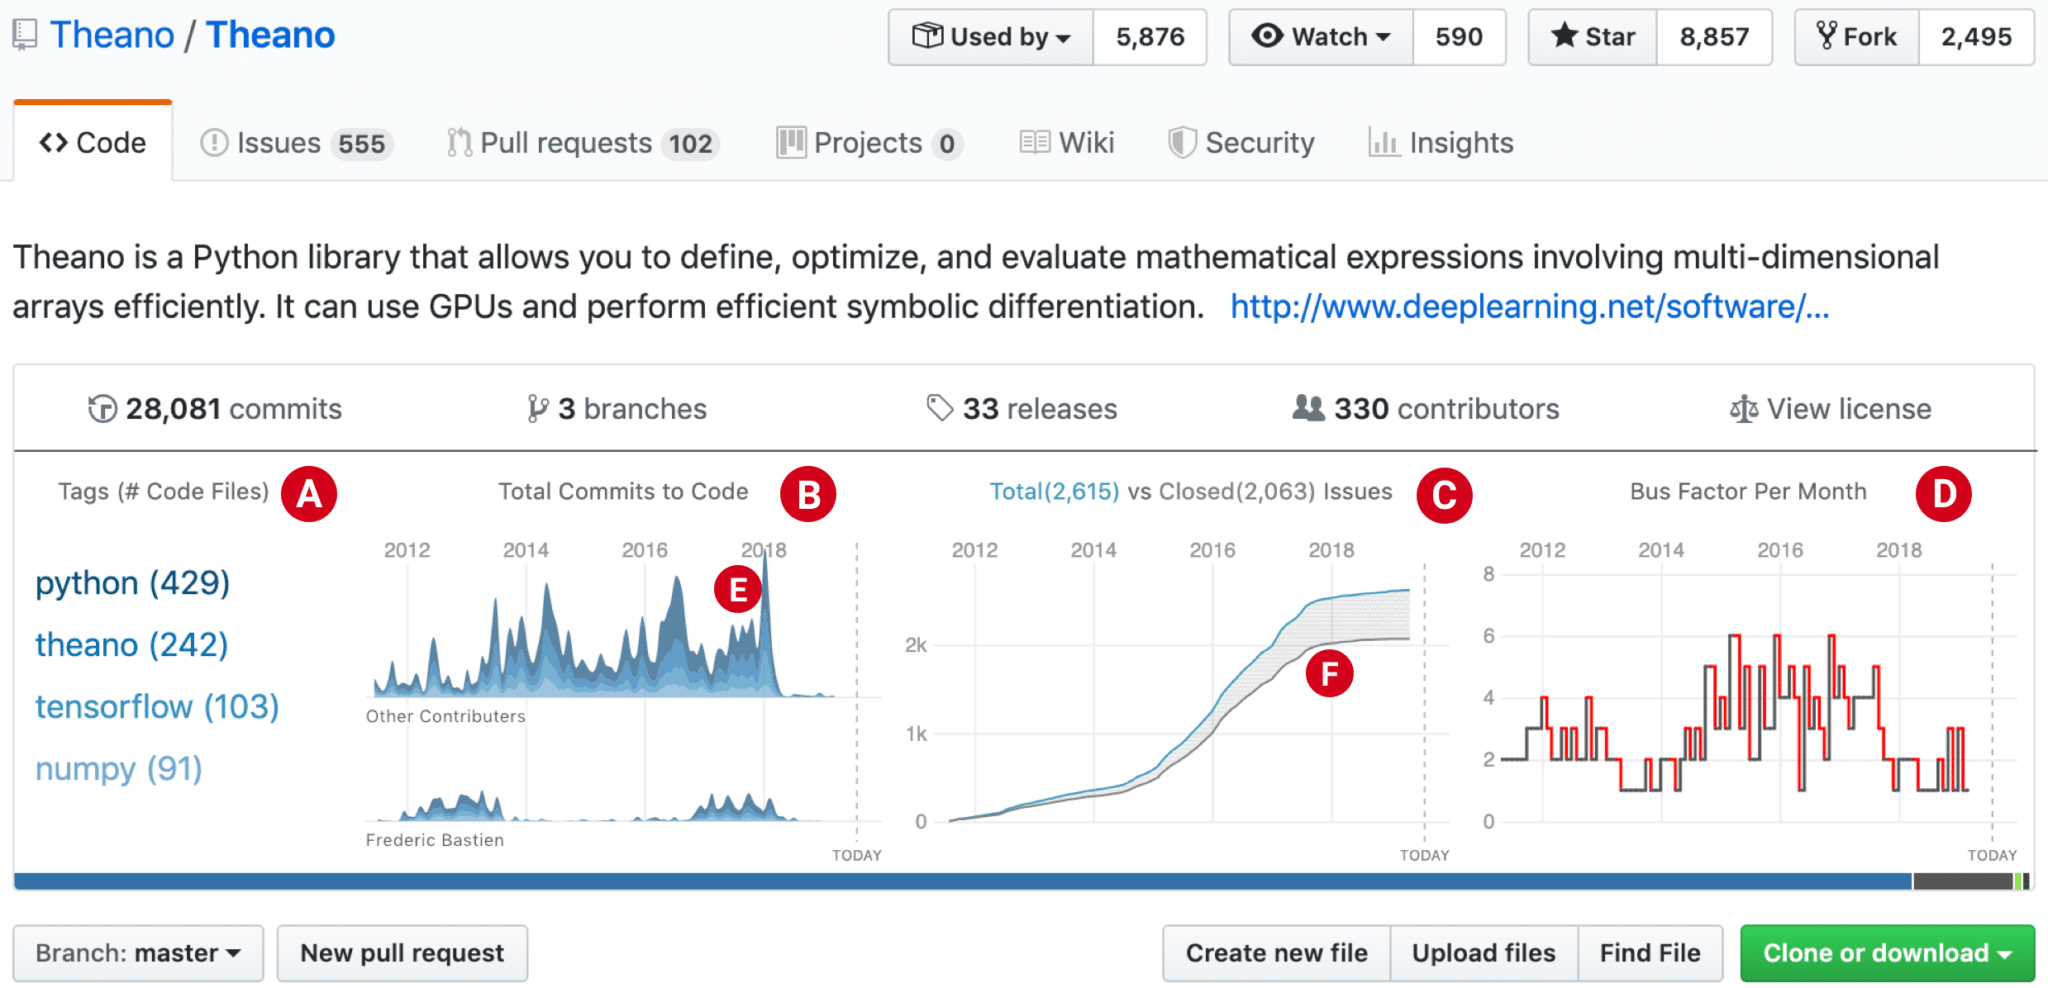
We designed a small repository dashboard to more easily assess the above library maintenance risks. Our dashboard is a Chrome browser extension that seamlessly inserts into a GitHub repository’s webpage. The dashboard shows repository data processed by our backend server. Our dashboard components show these data:
- The Tags component (A) shows automatically generated tags for the repository’s files. The backend generates tags using our team’s model for tagging source code. The component presents the most common tags as well as the number of code files per tag. This provides insight into what is in the repo and what technologies the project uses.
- The Total Commits component (B) visually presents the number of commits and the commit content over time. The area charts show commits over time from the top committer, and all the other contributors combined. The color ties to the Tags component and shows how commit content has changed over time.
- The Total vs. Closed Issues component (C) displays the number of total issues and closed issues, also known as a burndown chart. This tells us how well the project’s maintainers keep up with bugs and requests.
- The Bus Factor component (D) shows the number of committers who authored the majority of the commits. I.e. how many contributors are doing most of the work.
Together these components address the six risks above by giving us a picture of the contributors, their contributions, their responsiveness, and the technologies used.
Analyzing Library Repositories
Going back to Theano’s GitHub page, we again analyze the repo but use our dashboard this time (see the screenshot above). Now we easily see that new commits and responses to issues both dropped off (E and F). The number of core developers decreased (D), which is a risk to future maintenance. We quickly see that Theano is not well maintained, and if we use it in a long-term project we risk problems.
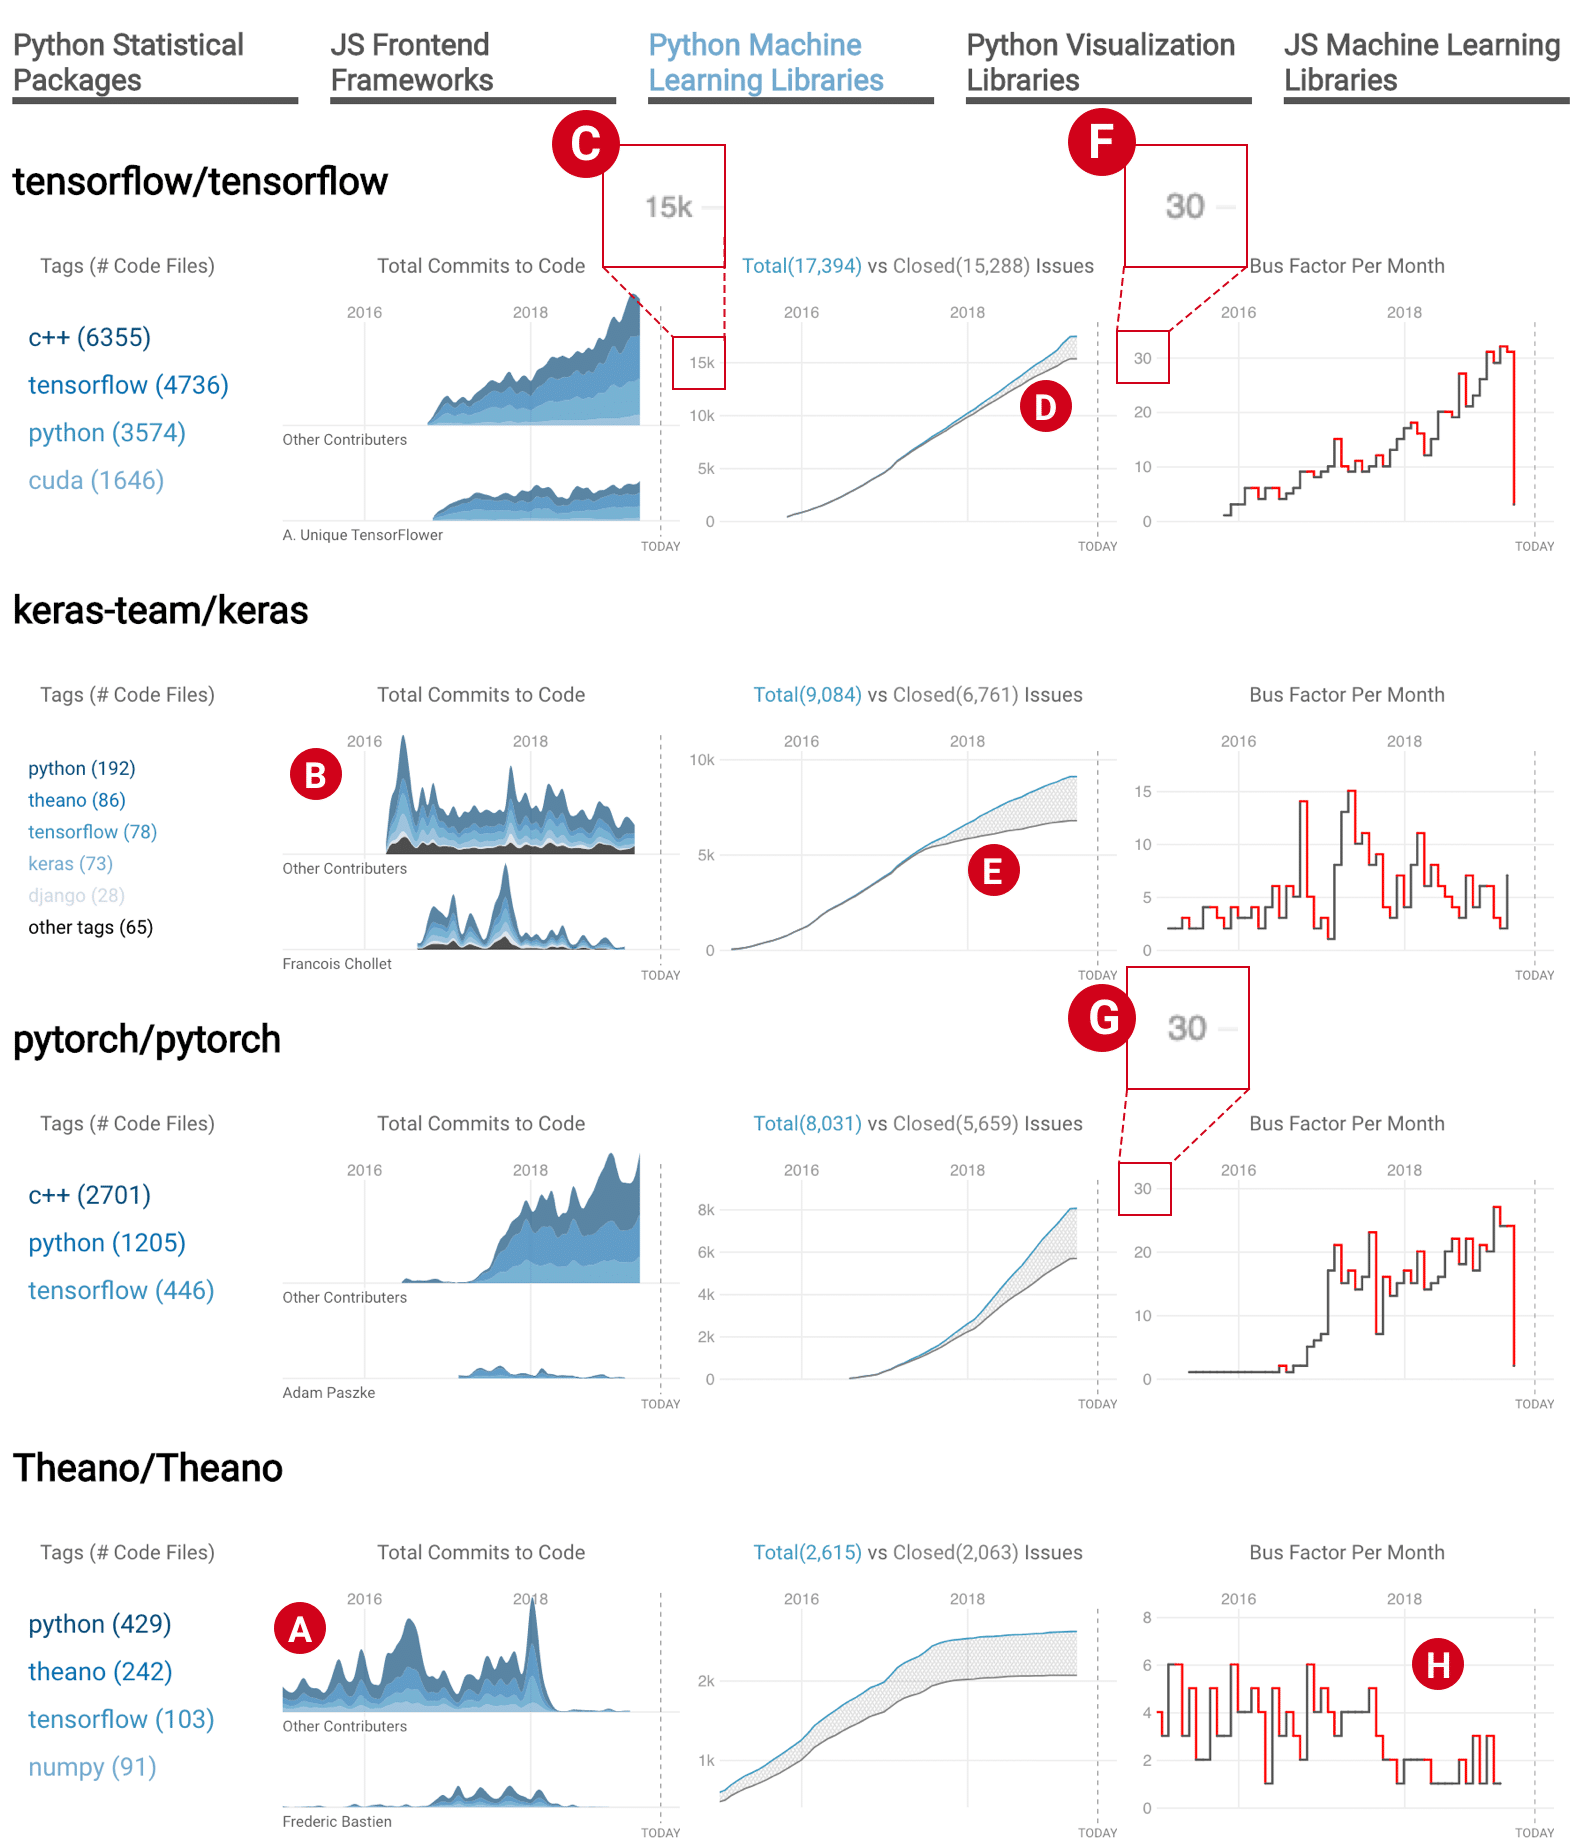
We also built a dashboard to compare multiple repositories, shown in the screenshot below. So we can see if other machine learning libraries are in a better state. In this screenshot we compare Tensorflow, Keras, Pytorch, and Theano. We easily see that Theano is the oldest, and its decline coincides with the rise of Tensorflow and Pytorch. Keras’ activity declines in 2016 as the lead author shifts focus to Tensorflow (B). Tensorflow and Pytorch have a very healthy bus factor (F and G)—we see a drop at the end, but this is an artifact of how the communities maintain the repos instead of a drop in maintenance. Tensorflow and Pytorch both look like better libraries to use in long-term projects.
Conclusion
Analyzing risks related to code maintenance is important, but we find it hard using GitHub and other repo management tools. But our simple dashboard makes this task easy. Our paper has more detail on the dashboard’s design and implementation.
Casey Haber and Robert Gove. “A Visualization Tool for Analyzing the Suitability of Software Libraries via Their Code Repositories.” Visualization and Data Analysis, pp. 387-1 — 187-11, 2019. [OSF preprint]
This project was sponsored by the Air Force Research Laboratory (AFRL) as part of the DARPA MUSE program.