I came to Two Six Labs to join the Data Science team at the beginning of July for a six month co-op internship. My co-op centered around creating a series of data visualizations for Arcus, a network anomaly detection system designed to detect Internet disruption events. We created a highly interactive dashboard to assist the team in network disruption detection research and a dynamically generated report to communicate identified disruption events. Timely, detailed information on ongoing and current internet disruptions, ranging from full network outages to Internet provider slowdowns, enables quick and effective responses by responsible parties, especially in the context of weather events. We used the system of visualizations to identify weather-related Internet disruption events and analyze how these weather events affected countries across geographic regions differently.
Case study 1: Matmo Mayhem
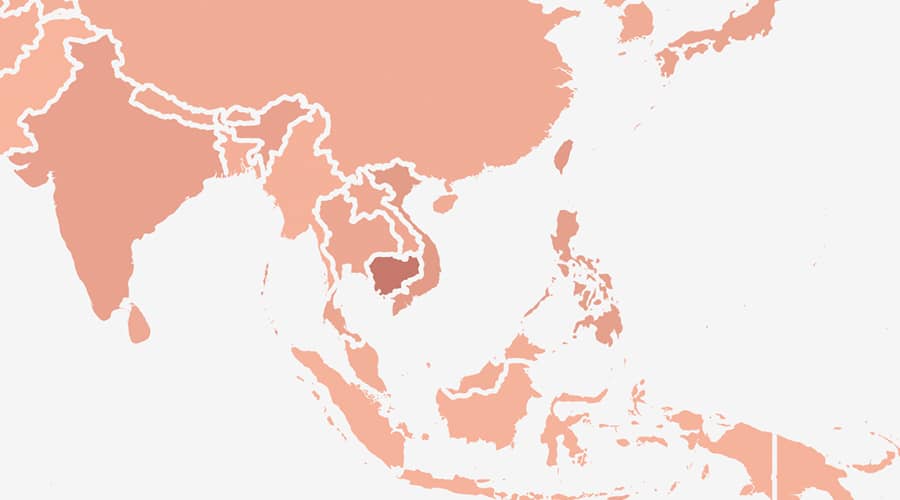
The Arcus system generated a report for an automatically detected disruption event that occurred on October 30, 2019 at 2 p.m. GMT. The disruption took place for 50 minutes, until 2:50 p.m., and affected Cambodia. This piqued our interest, so we decided to open up the same time range in the internal dashboard to investigate further with the more interactive interface.
We can see from the dashboard that the most affected country during the selected time range was Cambodia.
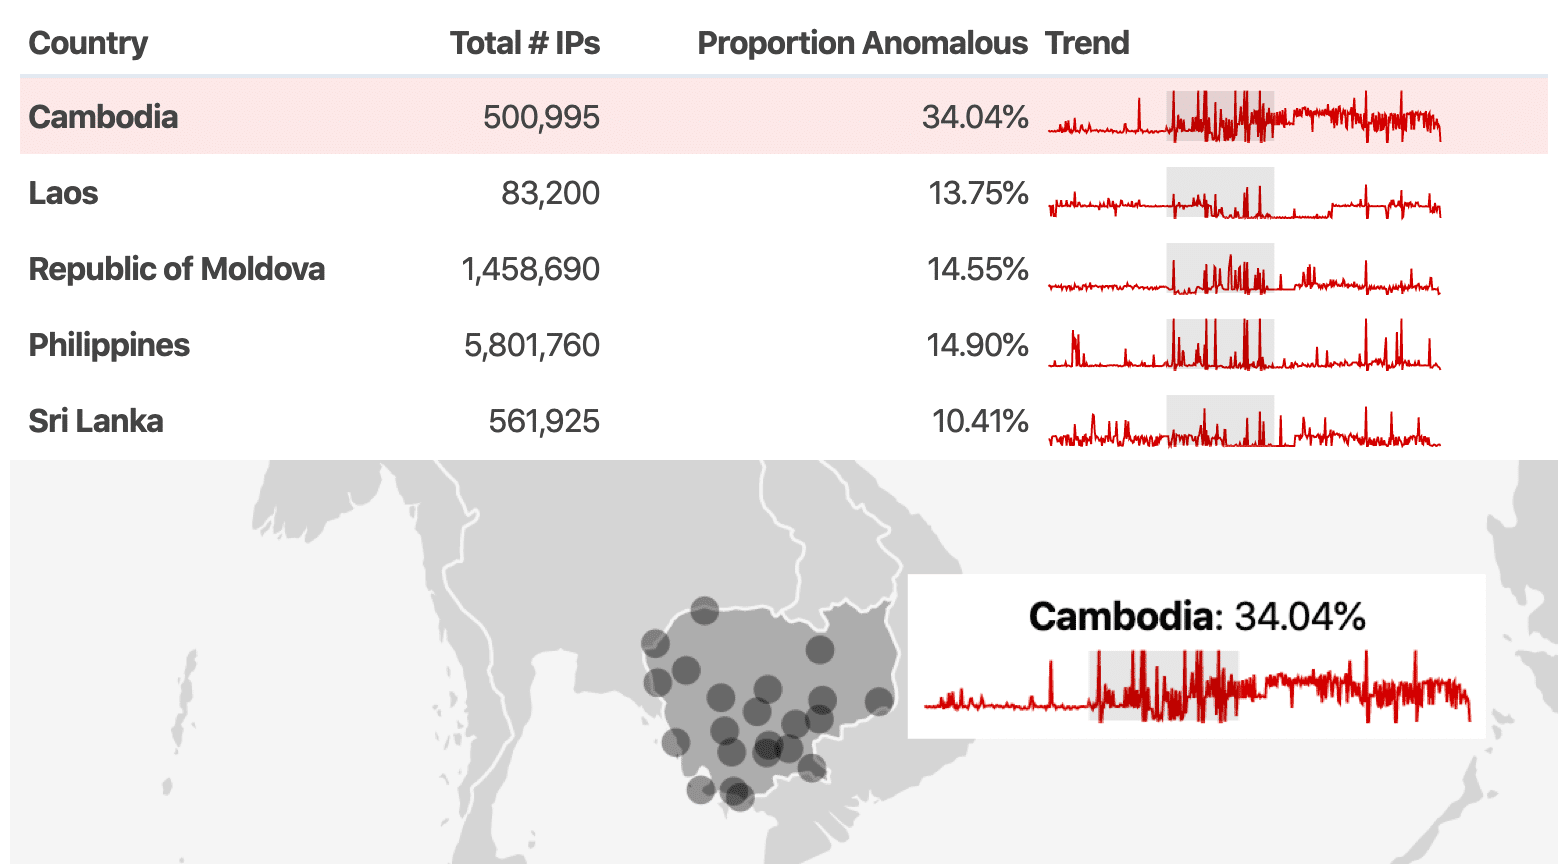
After selecting Cambodia, we could see that other countries in Southeast Asia, Laos, and the Philippines had similar trend lines, indicating a potential geographic disruption. We can also see that after the grey shaded region of the trend-line, it appears that Cambodia experienced a sustained level of disruption.
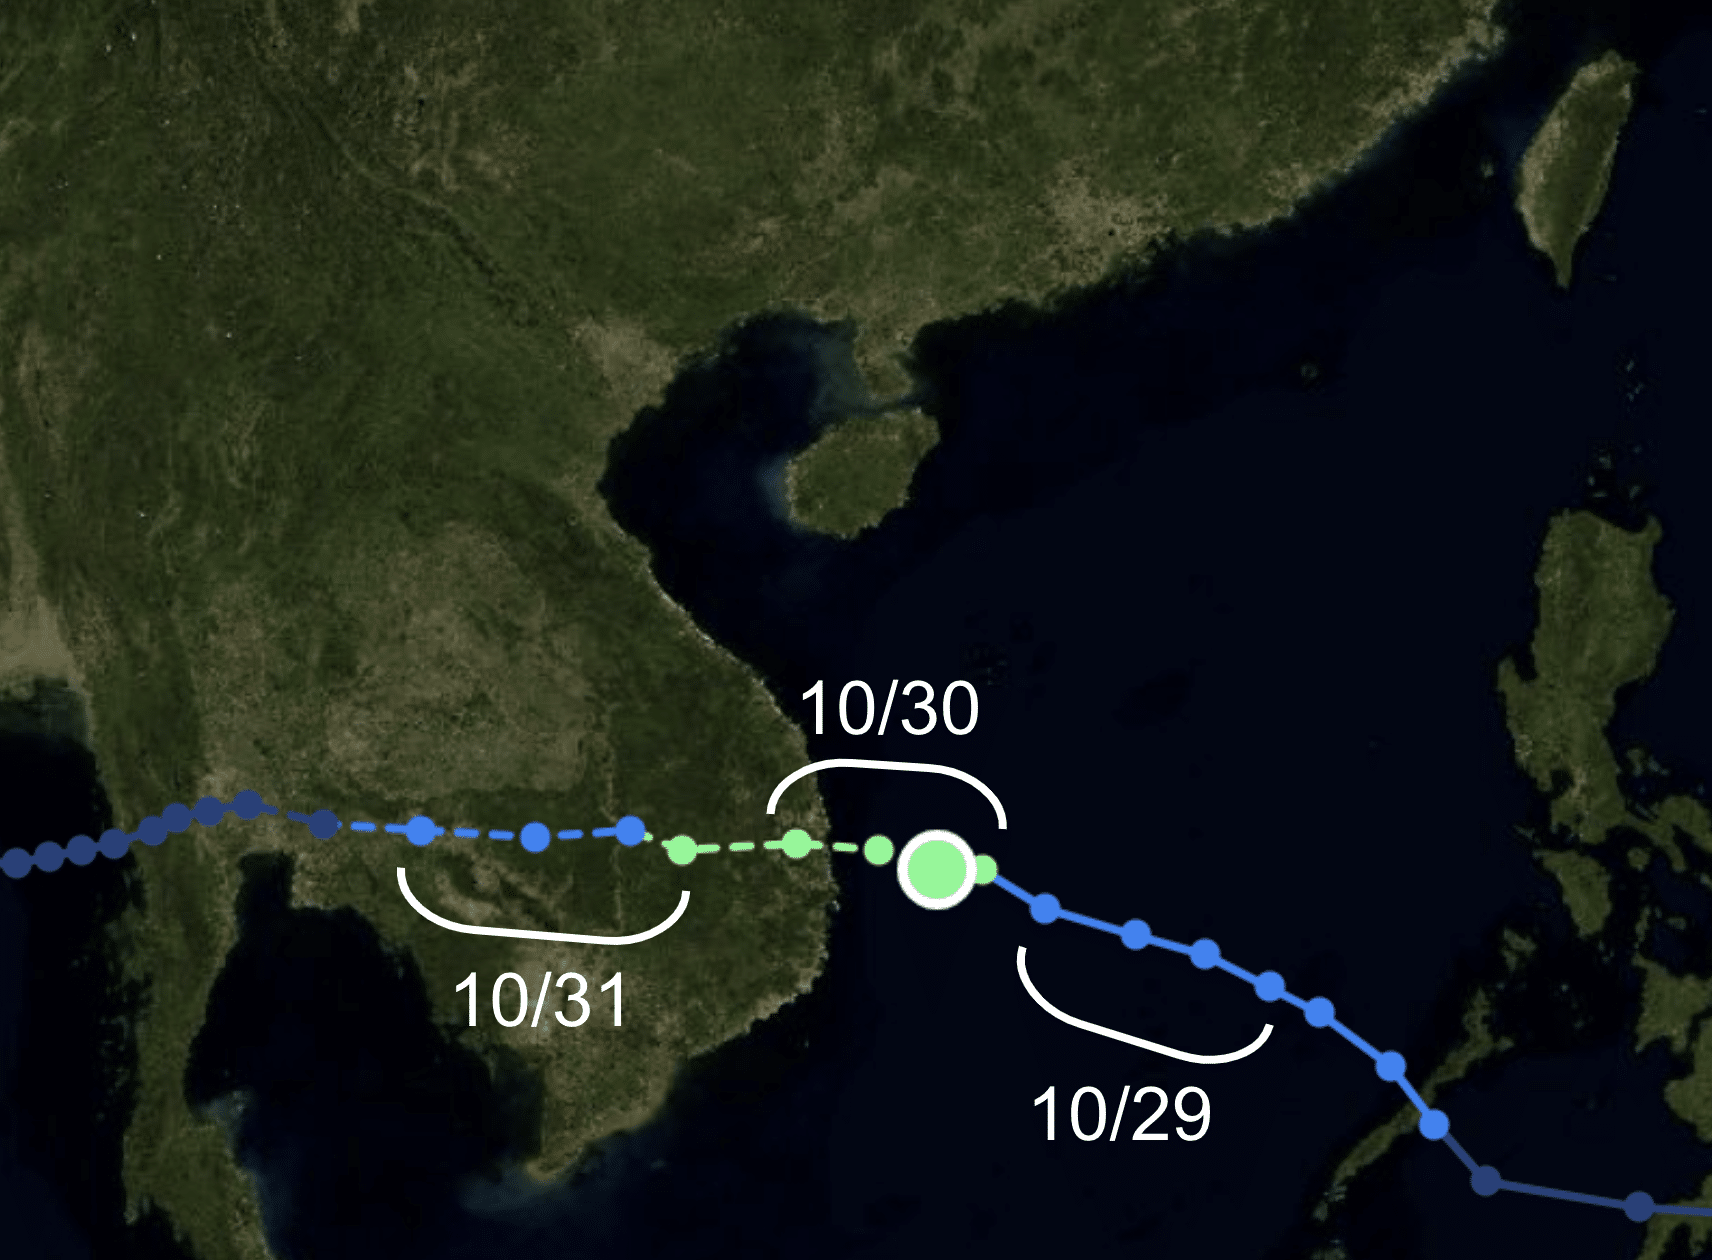
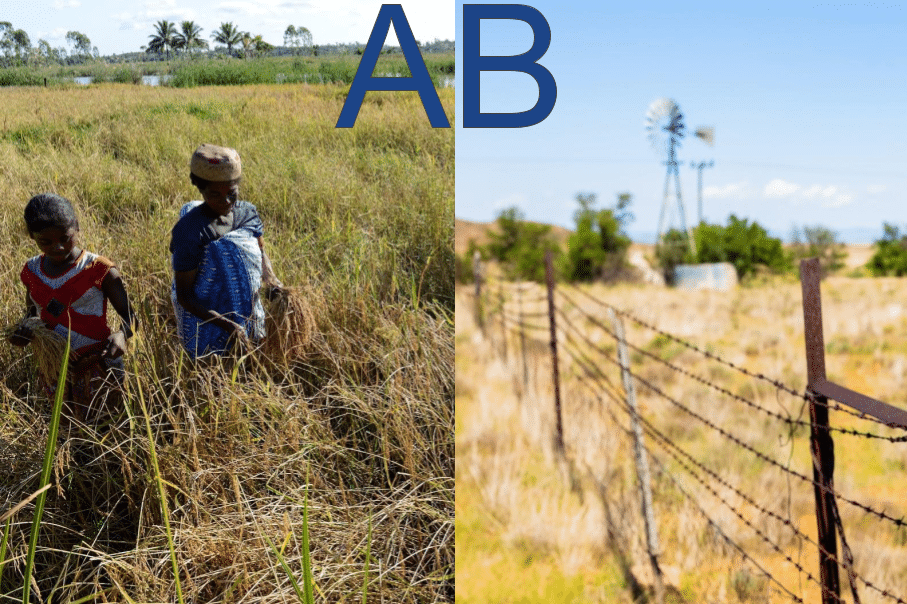
We later learned that Tropical Storm Matmo, which made landfall in Cambodia on October 30, 2019, coincided with this automatically detected disruption event. Tropical Storm Matmo caused heavy rains and high wind speeds in Cambodia, Laos, and Vietnam (image taken from Zoom Earth).
Case study 2: Terror in Trinidad and Tobago
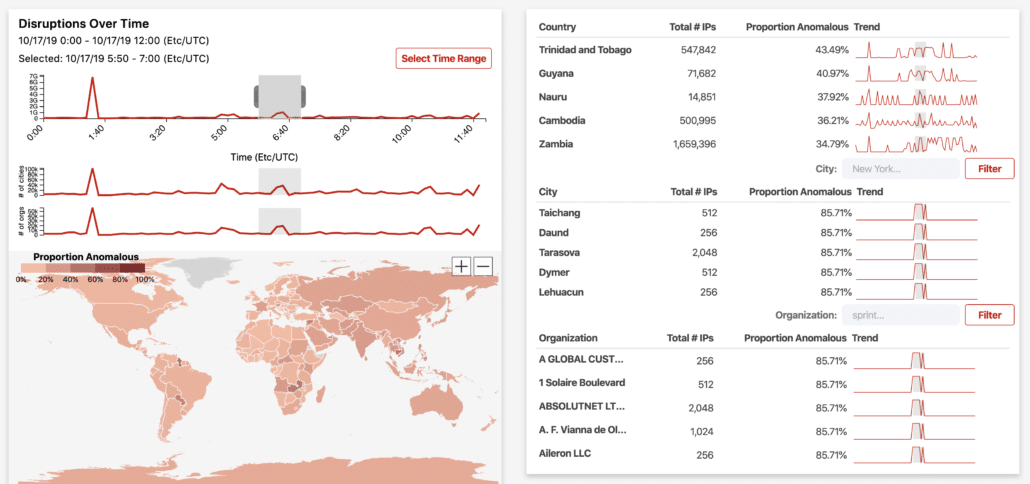
The Arcus system generated a report for an automatically detected disruption event that occurred on October 17, 2019 at 6:30 a.m. GMT. The disruption took place for an hour, until 7:30 a.m., and affected Trinidad and Tobago (as well as Zambia).
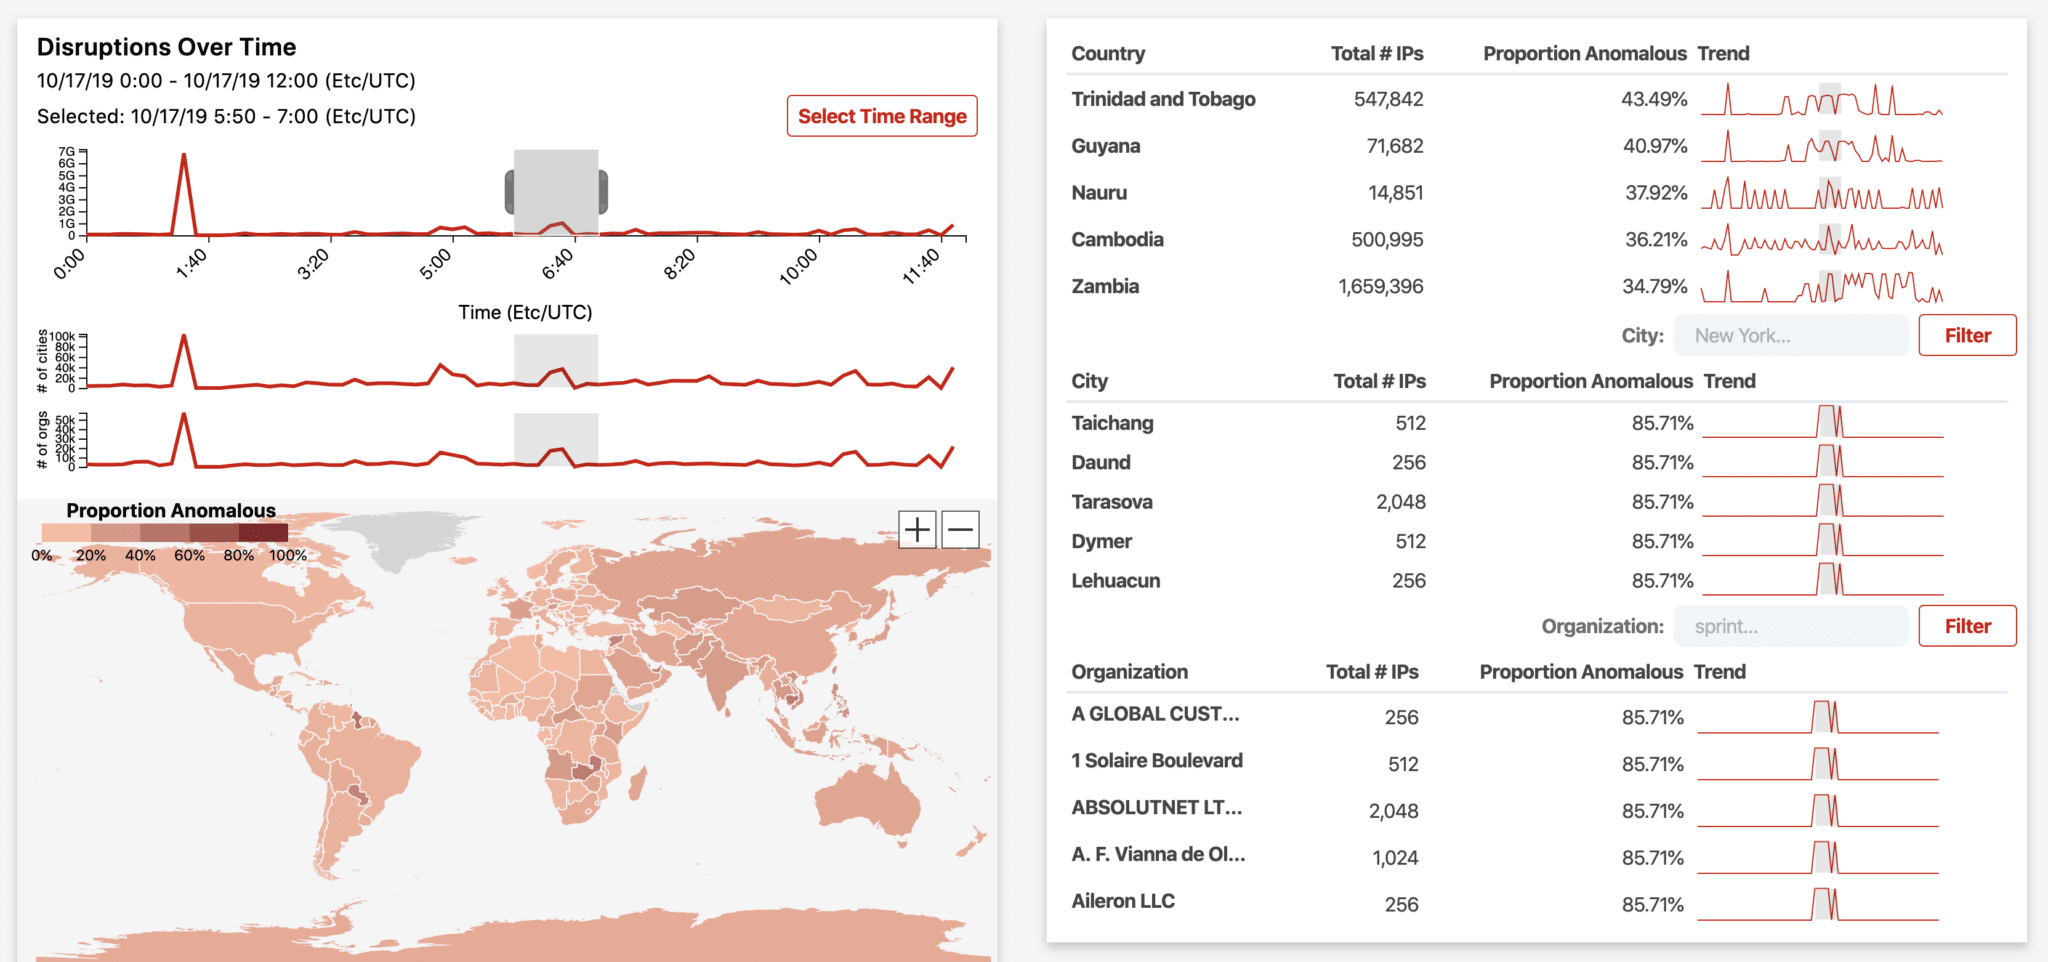
Upon opening the dashboard to look at the disruption, there appeared to be a geographic trend around Trinidad and Tobago, with both Trinidad and Tobago and Guyana showing similar disruption patterns.
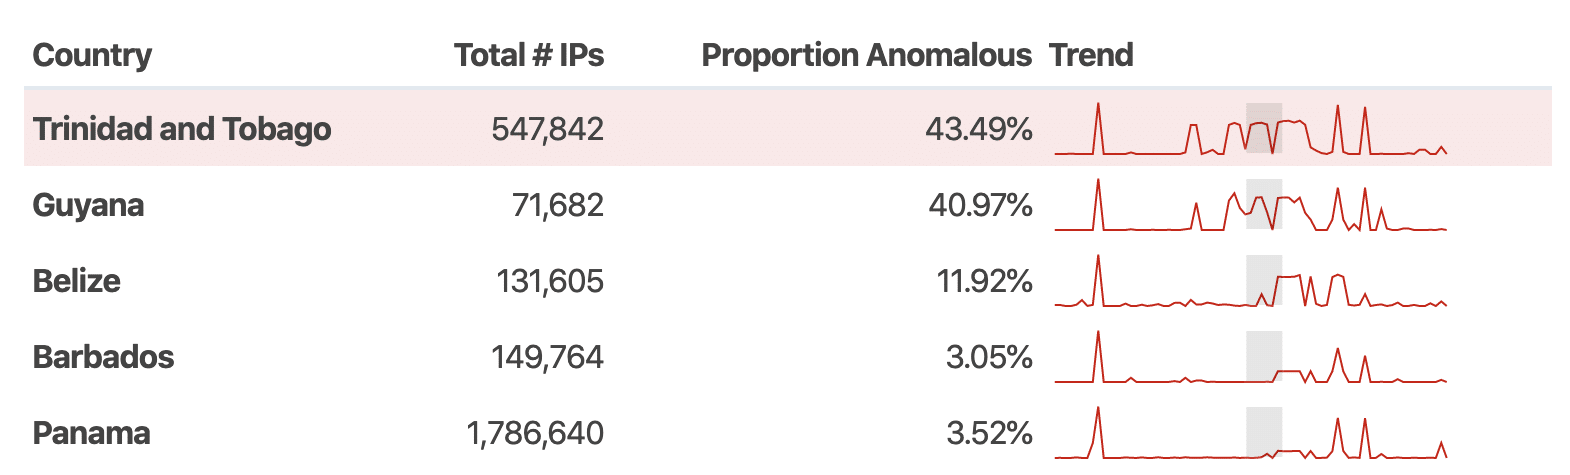
After focusing the dashboard on Trinidad and Tobago, we could see that surrounding countries (Guyana, Belize, Barbados, and Panama) had very similar disruption patterns, indicating a geographic event. We decided to look into weather events affecting Trinidad and Tobago on October 17th.
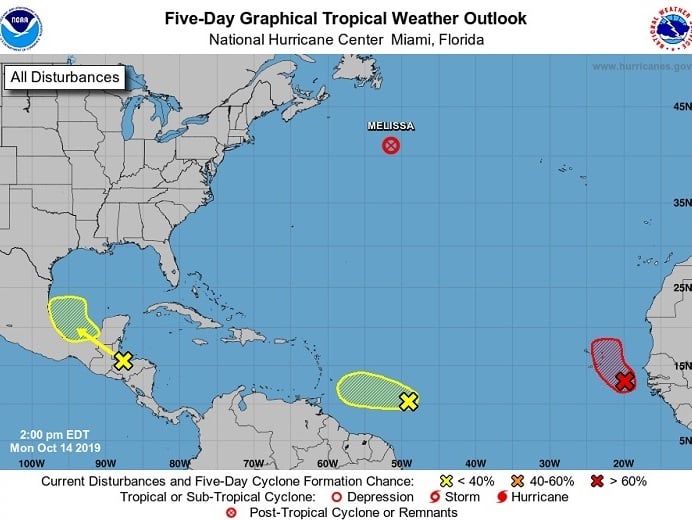
A tropical wave (an extended area of moderately low air pressure) event was predicted to hit the region on October 17th.
Conclusion
Because Arcus identifies Internet disruptions, the visualization system we created may be an effective way to evaluate Internet infrastructure resilience in different countries and regions, particularly as it relates to weather events. The effect of weather events on Internet connectivity is specific to the geographic area being affected, as well as the magnitude of the event.
Acknowledgements
I’d like to thank Tony Wong, Chae Clark, Robert Gove, and the entire Arcus team for their support on this project. Special thanks to Robert Gove for mentoring me on data visualization, tolerating my sense of humor, and editing this blog post.
This work was supported by Department of Homeland Security contract 70RSAT18CB0000018.