
Two Six Tech’s Review and Response to NATO’s Annual Tracking Research
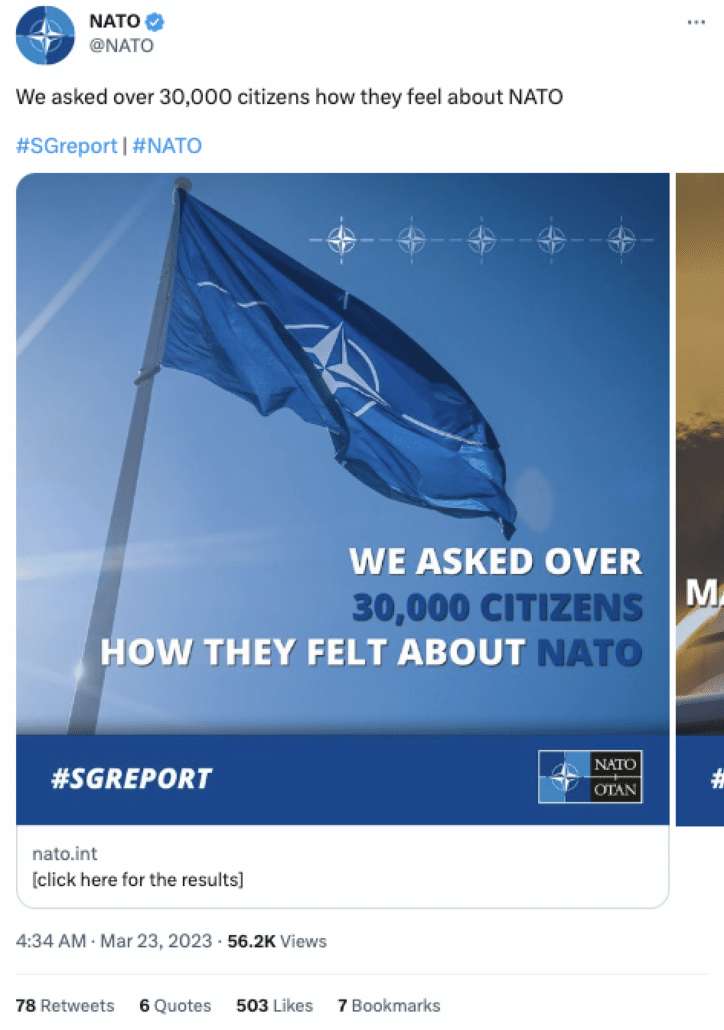
On 23 March 2023, NATO posted on Twitter the results of a 30,000-person survey across 30 allied countries, which sought to understand how participants felt about NATO (Figure 1). The tweet received negative comments across the information environment, including one stating, “So… you telling me that 30K interviews make representation enough for 950M citizens among all state members…Pathetic.” Is it pathetic? Let’s unpack the science.
Is the data representative?
Assuming fully randomized sampling, a 95% confidence level for a homogeneous population in the millions requires at least 385 respondents; NATO’s study includes 30 distinct countries [1]. According to NATO’s approach, each country’s sample size (n) was 1,000 except for Albania, Montenegro, and North Macedonia (n = 500 each). Criteria met.
Does a large sample size represent the population?
Not necessarily. The sample population should mirror the population under investigation in terms of demographic characteristics, such as age, gender, and location, at a minimum. However, even with these three dimensions, issues exist concerning representation. In its methodology, NATO states, “All data has been weighted according to the latest population statistics,” including gender, age, and region—weighting being a statistical technique to ensure the dataset aligns with the studied population. The language seems to indicate NATO applied due diligence.
Even assuming NATO applied the highest rigor in weighting, we cannot assume the sample reflects the population’s perspective. NATO admits the study relied on convenience sampling, where participants are included because they are easy to access and self-select to engage. Still, the methodology does not define the recruiting strategy or advertising design. Did most self-selecting participants already have a favorable view of NATO? There are measures to reduce this bias, but the methodology does not mention them; thus, it is unclear if the data represents ground truth. In short, NATO applies measures to increase the sample’s validity, but its data may fail to answer the objective: what 30 allied nations really think of NATO.
The user isn’t wrong to question the methodology since critique and critical thinking prevent lousy science from prevailing. Our clients are asked to do more with less, heightening the need for proper decision support with representative data. While many organizations lack NATO’s resources to conduct large-scale studies, Two Six can offer a more robust capability at a fraction of the speed and cost. We optimize survey results using the Total Survey Error framework, reducing error and bias while satisfying cost and time requirements [2], and we apply cutting-edge tradecraft to account for bias, accurately representing a population’s demographic considerations and perspective. Our findings reflect ground truth, separating us from competitors regarding intellectual rigor, reach, and data utility.
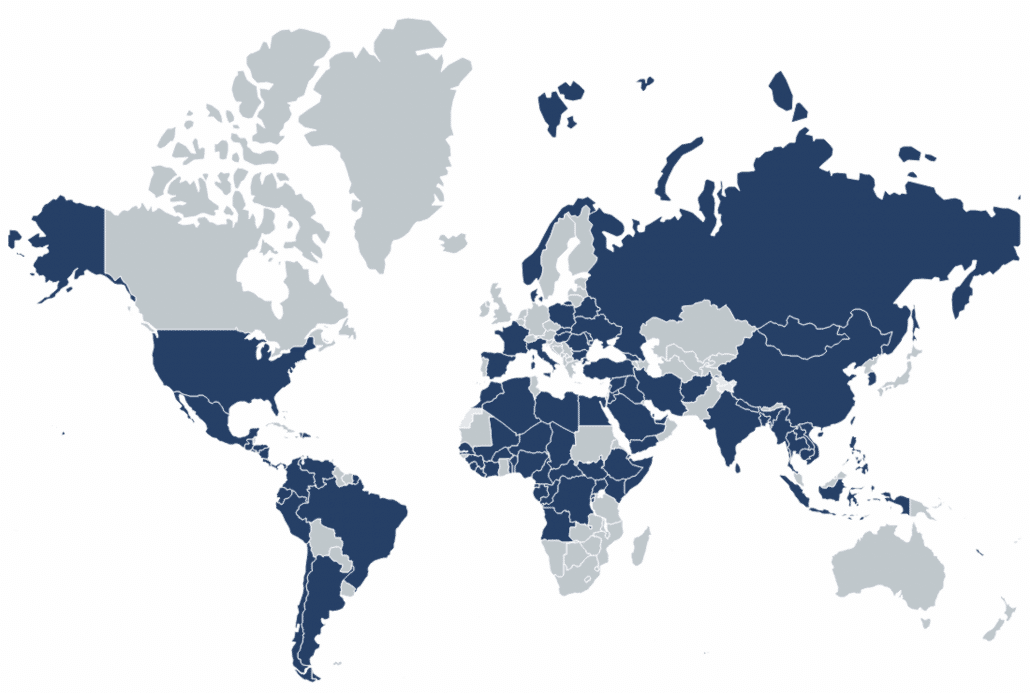
Over the last 5 years, we’ve conducted more than 150 studies across 91 countries in all major geographic regions, representing more than 2.1 million participants answering critical questions (Figure 2). We meet participants where they are and constantly innovate regarding reach, platform, and academic rigor, knowing our clients need ground-truth data for decision support.
- For a historical account of power analysis, see Descôteaux, J. (2007). Statistical power: An historical introduction. Tutorials in Quantitative Methods for Psychology 3(2), 28–34. http://doi.org/10.20982/tqmp.03.2.p028
- See Biemer, P. B. (2010) Total Survey Error: Design, implementation, and evaluation. Public Opinion Quarterly, 74(5), 817–848. https://doi.org/10.1093/poq/nfq058