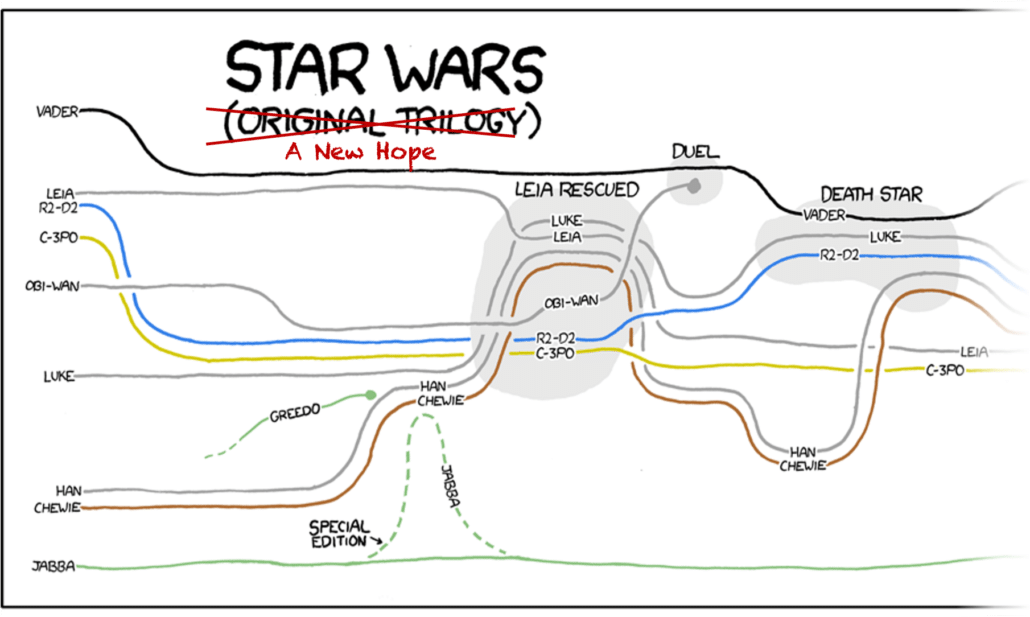
Log files contain data that are the narrative of cyber events: logs identify entities via a series of events about entities and the relationships between them. We have lots of cool ways to visualize narrative, like the xkcd narrative charts. But if we look closely these visualizations are missing minor characters and events. In other words, they show a summary instead of the full data.
Summaries like this are important to reduce cognitive load and direct analyst attention to the primary entities and events. But how can we automatically summarize a narrative? And how do we apply this to cyber narratives in log data?
Data Preparation
A simple way to prepare the data is to convert log lines into a dynamic graph, which is a type of graph that uses timestamps to annotate vertices and edges. From the log lines we extract entities, like IP addresses and usernames, which become the vertices in the graph. Relationships between entities, like a system log-in or a file transfer, become the edges. Timestamps tell us when these vertices and edges exist in time, and relationship types give us rich information. For example, BZAR relates network events to the MITRE ATT&CK framework. This tells us where this part of the narrative fits into the cyber attack progression, which we use later to infer importance.
We can use this type of data preparation for many other narrative sources, too. For example, incident reports typically contain log snippets that describe the details of a cyber event, which we can convert into a dynamic graph as above.
I store these dynamic graphs using STIX v2.1 JSON, which is an existing standard for describing cyber data.
Summarizing narratives
Once we have a dynamic graph of the narrative, we can calculate several scores that we’ll use to summarize it. Each score is a number between 0 (very unimportant) and 1 (very important). We have three types of scores.
Component Scores
We calculate four component scores on each connected component in the dynamic graph. These indicate each component’s importance to the narrative:
- The relative duration compared to the duration of the longest component.
- The relative number of entities compared to the number of entities in the largest component.
- The relative number of relationships compared to the number in the component with the most relationships.
- The relative number of timestamps compared to the number in the component with the most timestamps.
Branch Scores
The second set are branch scores for the branches in the narrative. Within a component we identify the core sequence of events by finding the earliest and latest entities in the component and then conducting a depth-first search between them. By subtracting this core sequence of events from the component we can identify the branches in the narrative. We score branches similarly to components, with higher scores (i.e. higher importance) for the core sequence of events, branches that occur later, have longer duration, more timestamps, more entities, more relationships, and more severe relationships (i.e. relationships from later attack stages in the MITRE ATT&CK framework).
Entity Scores
The third set is the individual entity scores. We normalize scores available from threat intelligence and cyber security analytics and then include them on the entities.
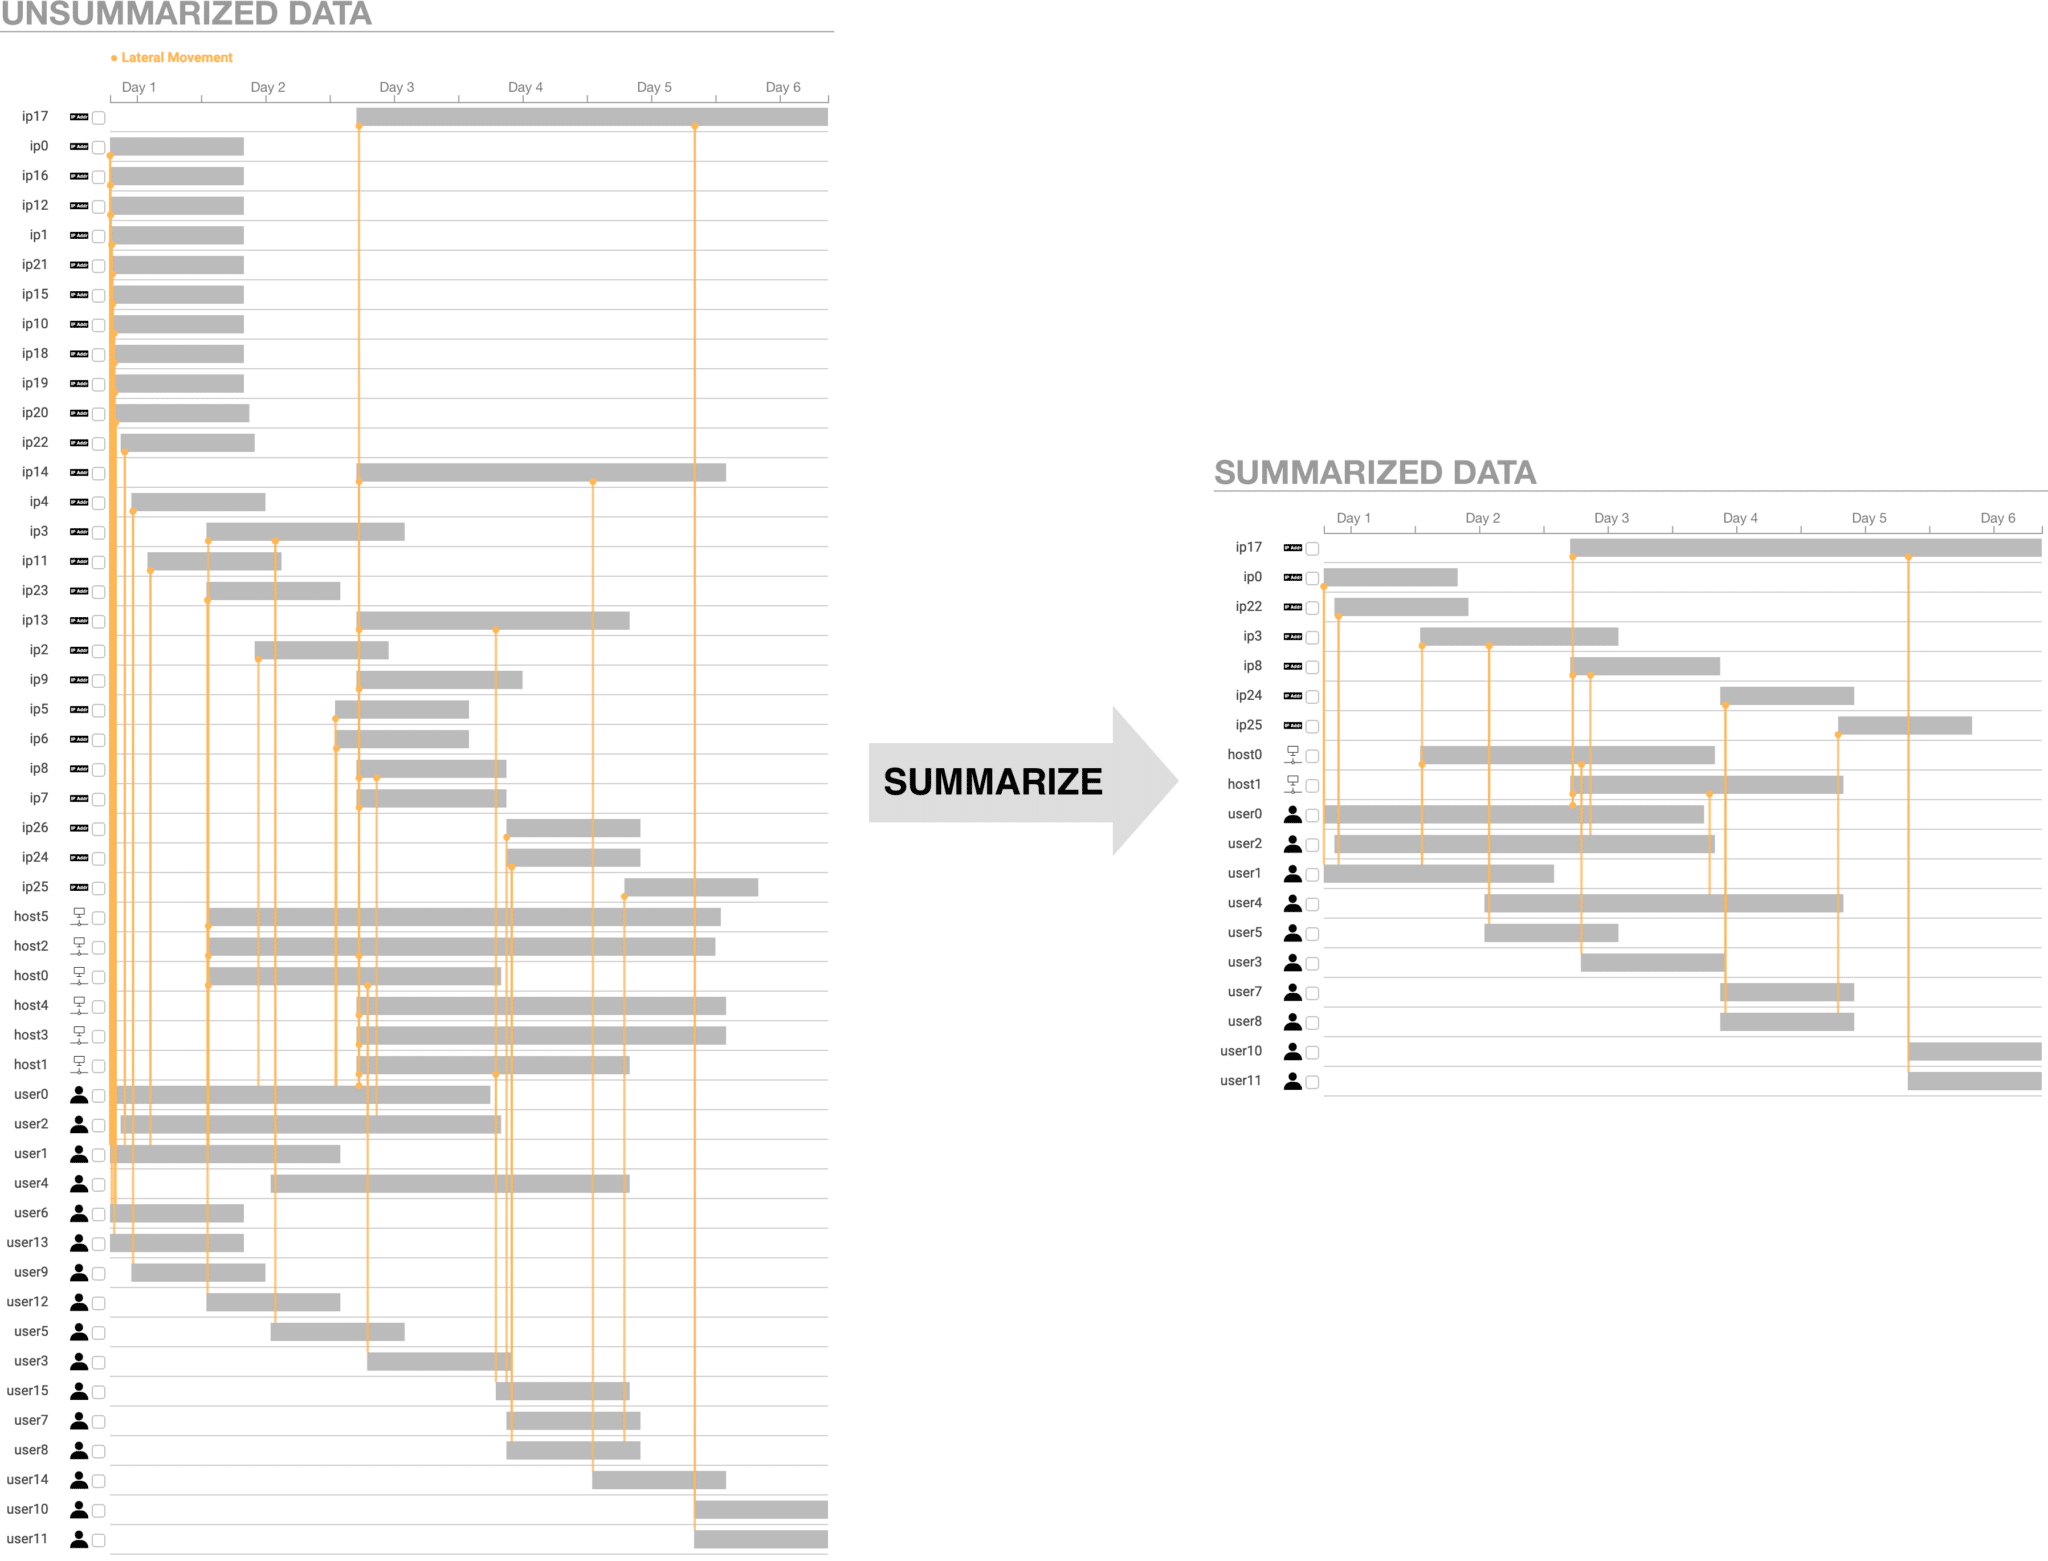
Deriving the Summary
We average the component, branch, and entity scores for each entity. The user specifies a summarization threshold, and we remove all entities whose average score is below the threshold. If a user wants a smaller summary, they increase the summarization threshold to remove entities with lower scores.
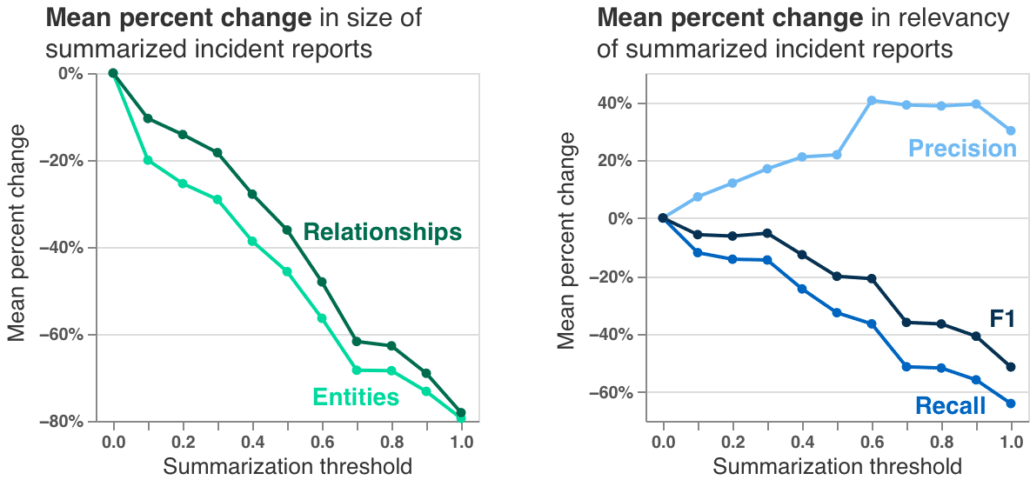
Summarization analysis
The summarization algorithm works pretty well! Testing on 15 incident reports, we can generate summaries about 80% smaller. And comparing to ground truth on our test network, we can even increase precision, which is a measure of the true positives in incident reports.
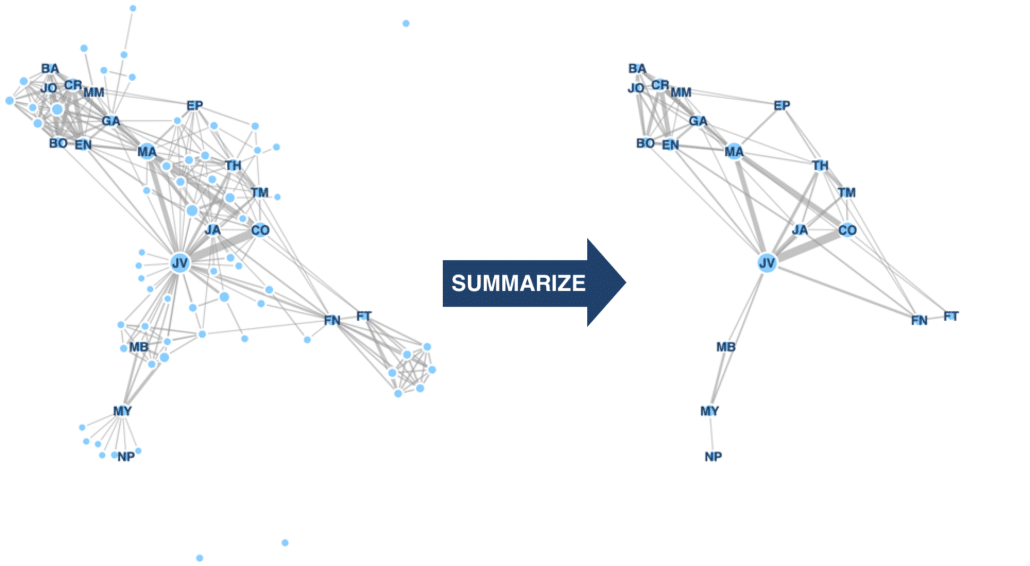
Summarizing other data
It turns out we can use this algorithm to summarize other types of dynamic graphs, like social networks. Ignoring the cyber security-specific scores, like threat scores, we can summarize the Les Misérables character interaction graph. This gives us the much smaller graph on the right of this figure. And we get a set of characters very similar to human-generated summaries from SparkNotes and CliffsNotes.
Conclusion
Summarization can be very helpful. We work with a security operations center analyst who commented that the summaries are very helpful and will save him a bunch of time. We can use this summarization method on a lot of different data sources such as log files or incident reports, even non-cyber data like social networks.
You can read more detail on the summarization algorithm and its performance in my research paper. I’m very excited my paper won the Best Paper Award at VizSec 2021 and it will be published in the IEEE Transactions on Visualization and Computer Graphics.
Citation:
Robert Gove. “Automatic Narrative Summarization for Visualizing Cyber Security Logs and Incident Reports” to appear in IEEE Transactions on Visualization and Computer Graphics. [preprint pdf]
Distribution Statement “A” (Approved for Public Release, Distribution Unlimited).