
An open-source data visualization application for scientific labs
Two Six Labs is pleased to introduce introduce Escalation, software developed in DARPA’s Synergistic Discovery and Design (SD2) program as a tool to accelerate scientific discovery. Escalation provides an at-a-glance summary of experimental results and analysis at low technical cost. The tool enables scientists to spend more time experimenting and reasoning about their results and less time wrangling data and running analysis code. Escalation may be useful for individual researchers or labs in the wider community, and so we have made the code available open-source.
What does Escalation do?
In brief, Escalation is a dashboard. An administrator builds a set of useful visualizations that will be automatically updated as data arrive. Teams can access these visualizations in a web browser to efficiently make data-driven decisions about their research. While the basic application is simple to operate, requiring no programming, the code is open and extensible, allowing labs to write new data workflows, interfaces, and visualizations to fit their specialized needs.
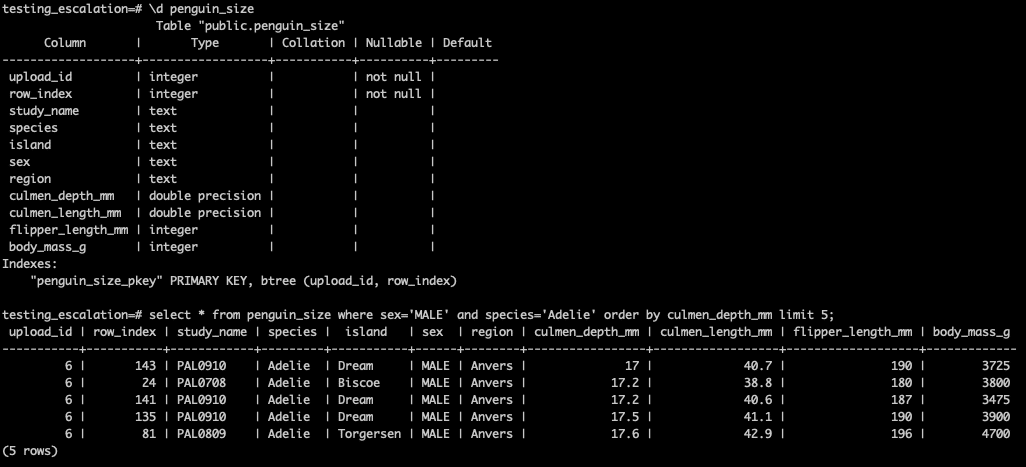
For the initial set up, Escalation provides a user interface to upload data files into an automatically-maintained Postgres SQL database. The system allows users to define which versions of the underlying data are current and should be used for analysis, and which are stored for historical purposes. It also generates links to download the most up-to-date files for use outside of the app.
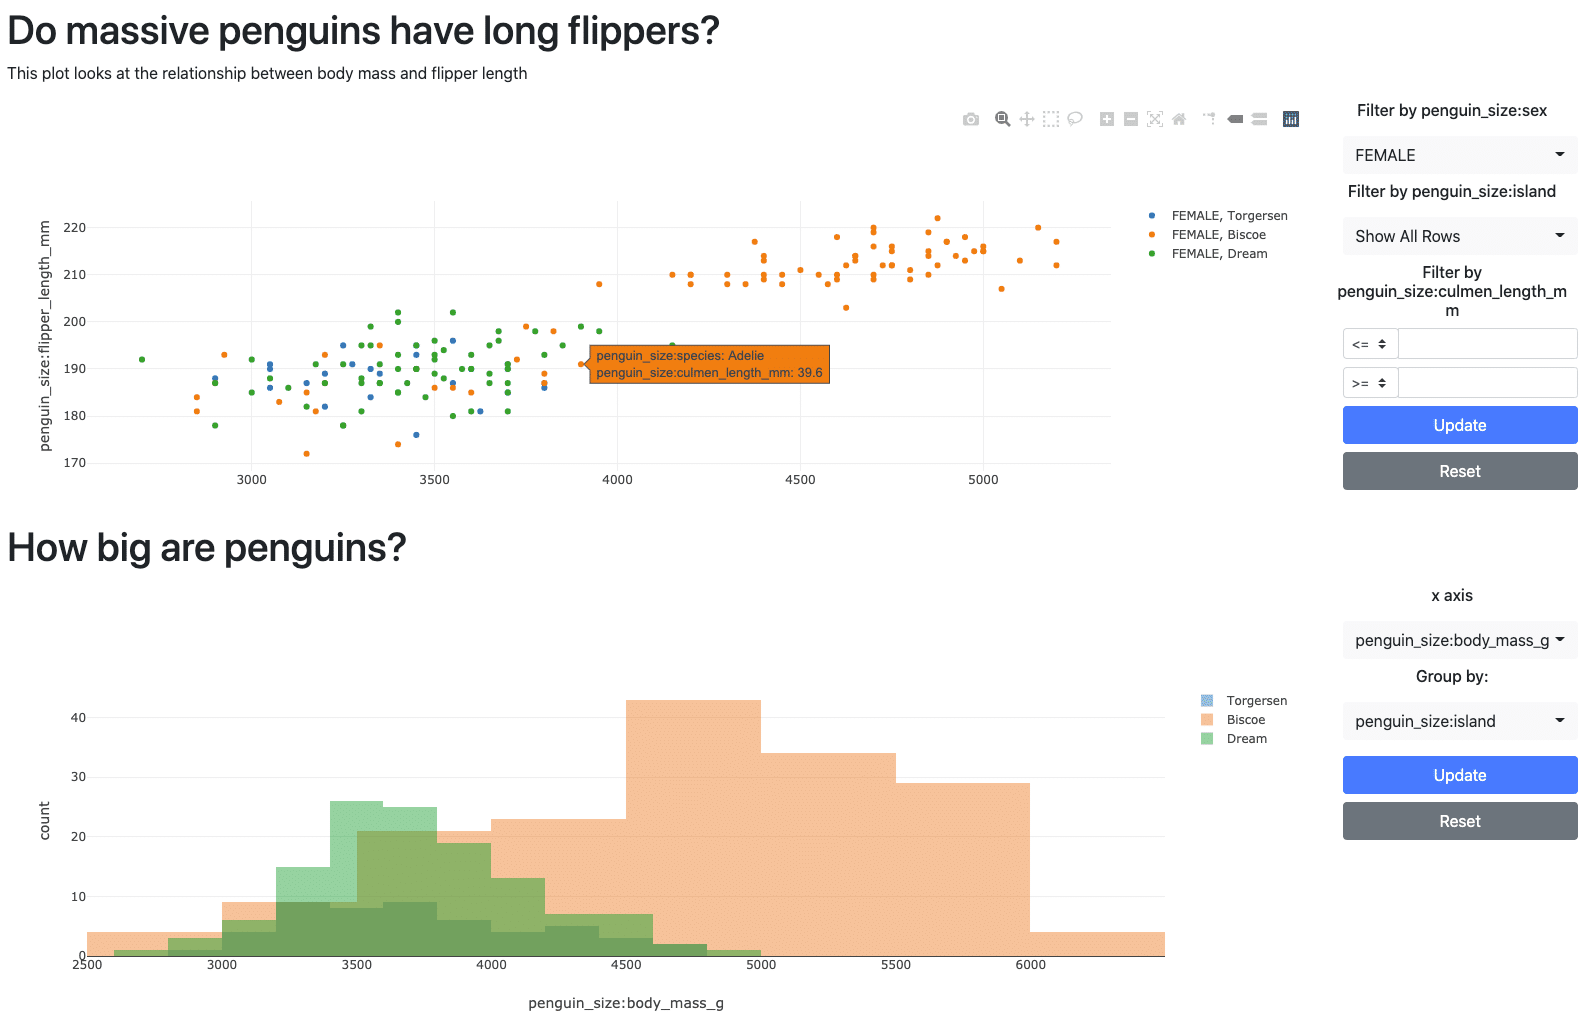
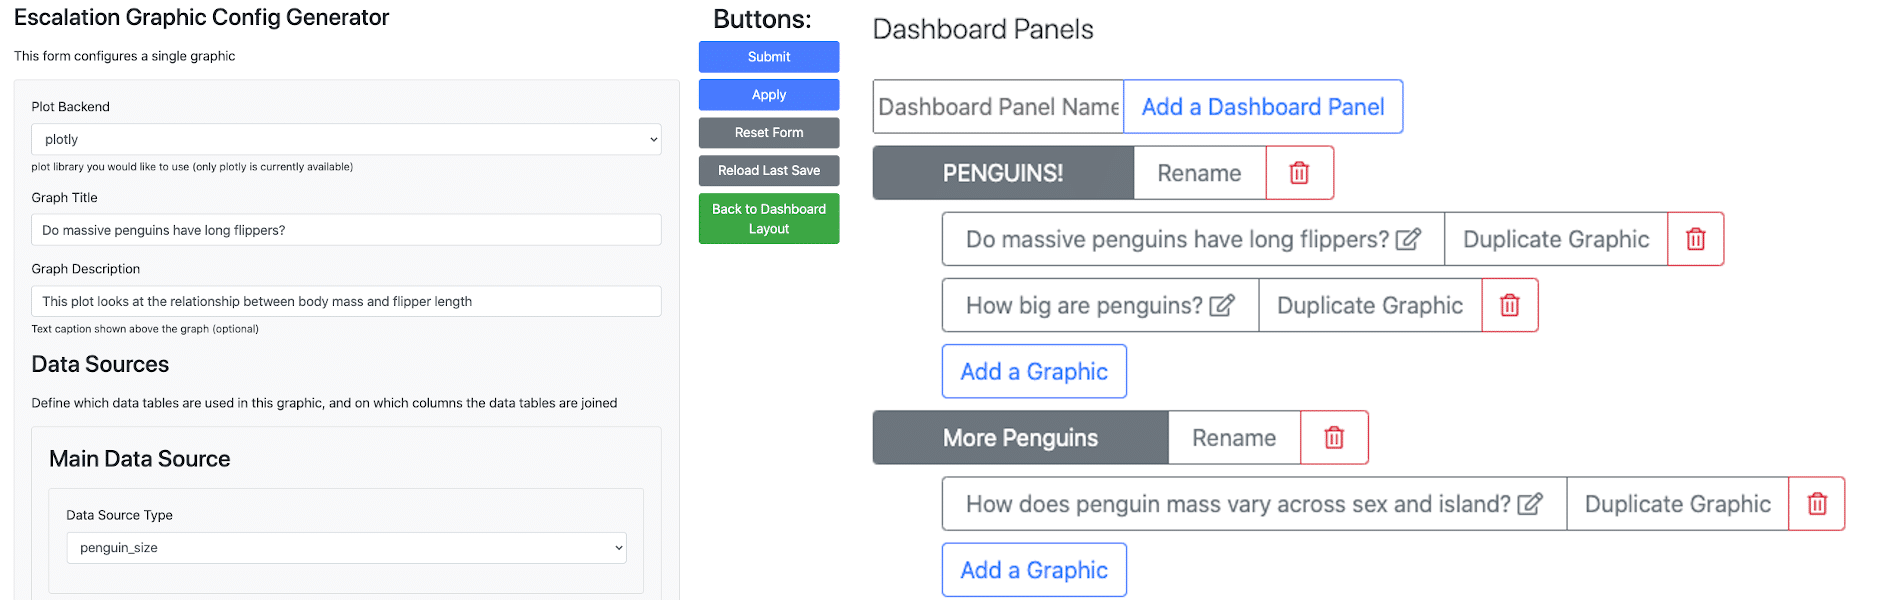
Users then specify the visualizations through Escalation’s user interface. After this setup, a graphics library called Plotly renders the visualizations in a browser window. These graphs are interactive, allowing the user to apply filters, change axes, view metadata about individual data points, etc. This means that instead of making dozens of individual static graph files with long filenames describing both the data used and the graph’s intent, there is one master graphic describing the analysis.
To use the web app, the software can be run privately on a laptop, on a shared lab computer, or, with a little more effort, on a server accessible to the internet. We defined the app using Docker Compose to handle the software dependencies, database setup, and app launch with a single terminal command. This also makes it easy for a user to deploy their customized dashboard for web hosting on a cloud provider like Digital Ocean or AWS.
Who could use Escalation?
There is a range of use cases where Escalation may be valuable. For example:
- An academic research lab wanting better visibility into results from experiments or analysis conducted by its members, or an at-a-glance record of incremental progress on a longer experimental program.
- A graduate student trying to organize and reason about a growing number of experiments run over time, spread over hundreds of CSV files on their hard drive.
- Authors publishing a data-enabled research paper—Escalation generates a website including dataset downloads and interactive visualizations to accompany a paper, without writing any code.
- Small commercial labs or project teams that may not have a software engineering group, but want to compare competing experimental methods or models throughout a program’s development.
Why use Escalation?
Escalation simplifies and consolidates data visualizations when you have a large number of data files, particularly if you’re generating more data over time. While other dashboards already exist, Escalation has a combination of features that make it unique and useful in the crowded field of visualization tools.
- We provide a “no-code” setup wizard that lets the user configure and run the app with only a few Docker commands in the terminal.
- The app is made for researchers; the graphing options and functionality are geared towards scientific visualizations, not web metrics for sales or marketing that are the focus of many dashboards.
- Configuring and deploying Escalation is low cost, both in time and money. There is no software licensing or subscription cost, and the app can be run on a laptop, on a shared lab computer for local collaboration, or on a cloud service for sharing over the internet.
- Because the app can be run locally or on a private network, there is improved data privacy compared to software-as-a-service dashboards.
- Escalation creates and maintains a SQL database of uploaded data that can be accessed and queried independently of the app. This database may benefit many labs that otherwise would not set up a centralized data store.
Escalation is open source, well-documented, and easily extensible. The web app is implemented in Python using the Flask framework and common tools. Many dashboards are proprietary, closed code that either has the feature you need behind a paywall or the feature is simply not available.
Two use cases of Escalation in SD2
DARPA’s SD2 program is divided into “challenge problems” that each tackle different scientific questions.
Yeast States Challenge Problem
The Yeast States Challenge Problem uses Escalation as a view into their experiments designing and testing genetic logic circuits for use in synthetic biology. They engineer yeast strains and measure their growth rate and the function of the designed circuits under different conditions, producing a large and growing set of data and analysis files covering different data types (e.g., flow cytometry and plate reader measurements). Changes in the dataset over time make it hard to discuss the underlying science without sharing various files with subtly different names. Many static graph files are needed to make the large number of comparisons needed for analysis. Escalation addresses these issues by aggregating the most up-to-date data and analysis files and presenting interactive graphs that let users select the comparisons needed for the moment. Dr. Robert Moseley, a researcher on the challenge problem, said about Escalation,
“All the pages look great and are extremely helpful. Just from exploring these figures…, I already learned a lot about our circuits (like the ones I designed didn’t work, yay!). This will save us A LOT of time. I feel like I’m understating how helpful and time-saving the work you guys have done is.”
Perovskites Challenge Problem
The Perovskites Challenge Problem uses Escalation to summarize an experimental program that aims to predict, assay, and refine crystallization reactions producing perovskites for uses such as photovoltaics. These experiments are run by both humans and robots, across multiple labs, with machine learning and predictive work contributed from further institutions. Professor Joshua Schrier at Fordham University is one of the challenge problem leads. He says,
“The Escalation dashboard gives everyone on our team the ability to get an overview of experimental progress. At a glance, we can see what experiments have been done, access benchmark machine learning model performance metrics, and use model feature importance measures to estimate important physical variables. We also use the Escalation dashboard to share datasets and to collect proposed experiments from users.”
This last point highlights the flexibility of Escalation’s open code. The users wanted to set up a Kaggle-like contest to choose the next round of experiments based on the past success of predictive models. They were able to build this experiment submission tracking and leaderboard functionality into the web dashboard along with their experimental analysis.
Using Escalation
You can find the code, and instructions for using the software, on Github. We welcome bug reports, merge requests, and feature requests, and plan to continue development. If you’re interested in using the app, but think you may need some help, shoot us a message describing your use case and situation at [email protected]. We’re happy to informally provide support as we refine the software’s documentation and make it easier to use.